Automating IRS Form 990 Data Extraction - A Computational Approach to Nonprofit Financial Metrics
Abstract
This study presents a computational methodology for extracting and analyzing financial data from IRS Form 990 filings to calculate program efficiency and fundraising efficiency metrics for nonprofit organizations. The approach focuses on navigating the complex structure of Form 990 XML files, which vary across different schema versions and years. By developing a robust extraction algorithm that accounts for these variations, the research demonstrates the feasibility of programmatically analyzing nonprofit financial performance across multiple years. The methodology is applied to United Way Worldwide filings from 2013-2022, producing longitudinal data on program efficiency (percentage of expenses allocated to program services) and fundraising efficiency (fundraising expenses relative to contributions). The application of this methodology to United Way Worldwide filings revealed consistent program efficiency above 80% and fundraising efficiency between 4-6.5% over a ten-year period, with some fluctuations associated with broader economic conditions. This computational approach addresses the limitations of manual extraction methods and third-party APIs, providing researchers and stakeholders with a more comprehensive toolkit for nonprofit financial analysis.
Introduction
The IRS Form 990 serves as the primary source of financial information for tax-exempt organizations in the United States, offering a wealth of data on revenue, expenses, governance, and operational activities. These publicly available filings provide critical insights into nonprofit financial performance, enabling stakeholders to evaluate organizational effectiveness and accountability. However, programmatically accessing and analyzing this data presents significant challenges due to the complexity of the repository structure and variations in XML schemas across different years.
Previous research has highlighted the limitations of relying on third-party platforms such as ProPublica’s Nonprofit Explorer for comprehensive financial analysis, as these sources often contain only subsets of the available data with limited timeframes and fields. Building upon earlier work that mapped the IRS Form 990 repository structure, this study advances a methodological approach to extract specific financial metrics directly from the source XML filings.
The primary metrics of interest in this analysis are program efficiency and fundraising efficiency, which provide insights into how effectively nonprofit organizations utilize their resources. Program efficiency, calculated as the ratio of program service expenses to total expenses, indicates the percentage of resources dedicated to mission-related activities. Fundraising efficiency, measured as the ratio of fundraising expenses to total contributions, reveals the cost associated with generating donation revenue.1
The challenges in extracting these metrics from Form 990 filings stem from several interconnected factors. The IRS has released multiple schema versions over the years (e.g., 2013v3.1, 2022v5.0), each with potential variations in element naming and structure, creating inconsistencies that must be accounted for in any extraction methodology. Additionally, the downloaded files often contain XML embedded within HTML structures, requiring additional preprocessing steps to isolate the actual data elements. XML namespaces present another technical hurdle, as they must be properly managed to access the relevant elements within the hierarchical structure. Further complicating matters, financial data elements may have different names or paths across different schema versions, necessitating a flexible approach that can adapt to these variations while maintaining consistent data extraction.
This study demonstrates a computational approach to address these challenges through the development of a robust Python script that can extract financial data from multiple years of Form 990 filings. The methodology is applied to United Way Worldwide (EIN: 131635294) as a case study, analyzing its financial performance from 2013 to 2022.
Experimental
Code 1. XML data extraction and financial metrics calculation script for processing IRS Form 990 XML files. This script extracts financial data from HTML-wrapped XML files, handles namespace variations, and calculates nonprofit efficiency metrics.
import os
import re
import xml.etree.ElementTree as ET
from bs4 import BeautifulSoup
import pandas as pd
import matplotlib.pyplot as plt
def extract_real_xml_content(file_path):
"""Extract the actual XML content from HTML files that contain embedded XML."""
with open(file_path, 'r', encoding='utf-8') as file:
content = file.read()
# Look for the XML content within the HTML
return_pattern = r'<Return xmlns="http://www\.irs\.gov/efile".*?</Return>'
match = re.search(return_pattern, content, re.DOTALL)
if match:
return match.group(0)
# If that fails, try to extract from the webkit-xml-viewer-source-xml div
soup = BeautifulSoup(content, 'html.parser')
source_div = soup.find('div', id='webkit-xml-viewer-source-xml')
if source_div:
return_matches = re.findall(return_pattern, str(source_div), re.DOTALL)
if return_matches:
return return_matches[0]
return None
def find_element_by_paths(root, paths, namespace=None):
"""Find an element using multiple possible paths."""
for path in paths:
try:
# Try with namespace
if namespace and '{' not in path:
ns_path = path.replace('/', '/{' + namespace + '}')
if not ns_path.startswith('{'):
ns_path = '{' + namespace + '}' + ns_path
elem = root.find(ns_path)
if elem is not None and elem.text:
return elem.text
# Try without namespace
elem = root.find(path)
if elem is not None and elem.text:
return elem.text
# Try XPath with local-name
if '/' in path:
local_name = path.split('/')[-1]
for e in root.iter():
if e.tag.split('}')[-1] == local_name:
if e.text:
return e.text
except Exception:
continue
# Try regex approach for complex cases
try:
xml_str = ET.tostring(root, encoding='unicode')
for path in paths:
local_name = path.split('/')[-1]
pattern = rf'<{local_name}>([^<]+)</{local_name}>'
match = re.search(pattern, xml_str)
if match:
return match.group(1)
except Exception:
pass
return None
def extract_financial_data(xml_content):
"""Extract key financial data from Form 990 XML content."""
try:
# Clean up XML content
xml_content = re.sub(r'>', '>', xml_content)
xml_content = re.sub(r'<', '<', xml_content)
# Parse XML
root = ET.fromstring(xml_content)
# Determine namespace
ns = ''
if '}' in root.tag:
ns = root.tag.split('}', 1)[0][1:]
# Initialize data dictionary
data = {
'tax_year': None,
'schema_version': root.get('returnVersion', 'Unknown'),
'total_revenue': None,
'total_expenses': None,
'program_service_expenses': None,
'fundraising_expenses': None,
'total_contributions': None
}
# Extract tax year with various possible paths
tax_year_paths = [
'.//TaxPeriodEndDt',
'.//TaxYr',
'.//ReturnHeader/TaxPeriodEndDt',
'.//TaxPeriodEndDt'
]
tax_year_value = find_element_by_paths(root, tax_year_paths, ns)
if tax_year_value:
# Extract year from YYYY-MM-DD format if needed
if '-' in tax_year_value:
data['tax_year'] = tax_year_value.split('-')[0]
else:
data['tax_year'] = tax_year_value
# Extract financial data using various possible element paths
revenue_paths = [
'.//IRS990/CYTotalRevenueAmt',
'.//IRS990/TotalRevenueAmt',
'.//ReturnData/IRS990/CYTotalRevenueAmt',
'.//ReturnData/IRS990/TotalRevenueAmt',
'.//TotalRevenue',
'.//CYTotalRevenueAmt',
'.//IRS990/TotalRevenue/TotalRevenueColumnAmt'
]
data['total_revenue'] = find_element_by_paths(root, revenue_paths, ns)
expense_paths = [
'.//IRS990/CYTotalExpensesAmt',
'.//IRS990/TotalExpensesAmt',
'.//ReturnData/IRS990/CYTotalExpensesAmt',
'.//ReturnData/IRS990/TotalExpensesAmt',
'.//TotalExpenses',
'.//CYTotalExpensesAmt',
'.//IRS990/TotalFunctionalExpenses/TotalAmt'
]
data['total_expenses'] = find_element_by_paths(root, expense_paths, ns)
program_expense_paths = [
'.//IRS990/TotalProgramServiceExpensesAmt',
'.//ReturnData/IRS990/TotalProgramServiceExpensesAmt',
'.//TotalProgramServiceExpensesAmt',
'.//IRS990/TotalFunctionalExpenses/ProgramServicesAmt'
]
data['program_service_expenses'] = find_element_by_paths(root, program_expense_paths, ns)
fundraising_paths = [
'.//IRS990/CYTotalFundraisingExpenseAmt',
'.//IRS990/FundraisingExpensesAmt',
'.//ReturnData/IRS990/CYTotalFundraisingExpenseAmt',
'.//ReturnData/IRS990/FundraisingExpensesAmt',
'.//CYTotalFundraisingExpenseAmt',
'.//IRS990/TotalFunctionalExpenses/FundraisingAmt'
]
data['fundraising_expenses'] = find_element_by_paths(root, fundraising_paths, ns)
contribution_paths = [
'.//IRS990/CYContributionsGrantsAmt',
'.//IRS990/ContributionsGrantsAmt',
'.//ReturnData/IRS990/CYContributionsGrantsAmt',
'.//ReturnData/IRS990/ContributionsGrantsAmt',
'.//CYContributionsGrantsAmt',
'.//IRS990/TotalContributionsAmt'
]
data['total_contributions'] = find_element_by_paths(root, contribution_paths, ns)
# Convert numeric values
for key in ['total_revenue', 'total_expenses', 'program_service_expenses',
'fundraising_expenses', 'total_contributions']:
if data[key]:
try:
data[key] = float(data[key])
except ValueError:
data[key] = None
return data
except Exception as e:
print(f"Error extracting financial data: {str(e)}")
return {
'tax_year': None,
'schema_version': 'Error',
'total_revenue': None,
'total_expenses': None,
'program_service_expenses': None,
'fundraising_expenses': None,
'total_contributions': None
}
def calculate_efficiency_metrics(data):
"""Calculate program efficiency and fundraising efficiency metrics."""
if data['total_expenses'] and data['program_service_expenses'] and data['total_expenses'] > 0:
data['program_efficiency'] = data['program_service_expenses'] / data['total_expenses']
else:
data['program_efficiency'] = None
if data['fundraising_expenses'] and data['total_contributions'] and data['total_contributions'] > 0:
data['fundraising_efficiency'] = data['fundraising_expenses'] / data['total_contributions']
else:
data['fundraising_efficiency'] = None
return data
def analyze_directory(directory_path):
"""Analyze all XML files in the given directory and extract financial data."""
results = []
for filename in sorted(os.listdir(directory_path)):
if filename.endswith('.xml'):
file_path = os.path.join(directory_path, filename)
# Extract the XML content
xml_content = extract_real_xml_content(file_path)
if xml_content:
# Extract financial data
data = extract_financial_data(xml_content)
data['filename'] = filename
# Calculate efficiency metrics
data = calculate_efficiency_metrics(data)
results.append(data)
return results
def generate_financial_report(results):
"""Generate a financial report with efficiency metrics."""
# Convert to DataFrame for easier manipulation
df = pd.DataFrame(results)
# Sort by tax year
if 'tax_year' in df.columns:
df = df.sort_values(by='tax_year')
# Create markdown report
markdown = []
# Table 1: Financial Overview
markdown.append("**Table 1.** Financial Overview for United Way Worldwide (EIN: 131635294)\n")
markdown.append("| Tax Year | Schema Version | Total Revenue ($) | Total Expenses ($) | Program Expenses ($) | Fundraising Expenses ($) |")
markdown.append("|----------|----------------|-----------------|-------------------|---------------------|------------------------|")
for _, row in df.iterrows():
tax_year = row.get('tax_year', 'Unknown')
if tax_year != 'Unknown' and tax_year is not None:
markdown.append(
f"| {tax_year} | {row.get('schema_version', 'Unknown')} | " +
f"{format_currency(row['total_revenue'])} | " +
f"{format_currency(row['total_expenses'])} | " +
f"{format_currency(row['program_service_expenses'])} | " +
f"{format_currency(row['fundraising_expenses'])} |"
)
markdown.append("\n")
# Table 2: Efficiency Metrics
markdown.append("**Table 2.** Efficiency Metrics for United Way Worldwide (EIN: 131635294)\n")
markdown.append("| Tax Year | Program Efficiency | Fundraising Efficiency |")
markdown.append("|----------|-------------------|------------------------|")
for _, row in df.iterrows():
tax_year = row.get('tax_year', 'Unknown')
if tax_year != 'Unknown' and tax_year is not None:
program_eff = format_percentage(row['program_efficiency']) if 'program_efficiency' in row else 'N/A'
fundraising_eff = format_percentage(row['fundraising_efficiency']) if 'fundraising_efficiency' in row else 'N/A'
markdown.append(
f"| {tax_year} | {program_eff} | {fundraising_eff} |"
)
# Create visualizations
create_visualizations(df)
return "\n".join(markdown)
def format_currency(value):
"""Format a value as currency."""
if value is None:
return "N/A"
return f"${value:,.2f}"
def format_percentage(value):
"""Format a value as percentage."""
if value is None:
return "N/A"
return f"{value:.2%}"
def create_visualizations(df):
"""Create and save visualizations of the financial data."""
# Ensure the directory exists
os.makedirs('visualizations', exist_ok=True)
# Clean up data for plotting - remove rows with missing essential data
df_plot = df.copy()
# Only include rows with tax year data
df_plot = df_plot[df_plot['tax_year'].notna()]
if len(df_plot) == 0:
print("No data available for visualizations")
return
# Sort by tax year
df_plot['tax_year'] = df_plot['tax_year'].astype(str)
df_plot = df_plot.sort_values(by='tax_year')
# Plot 1: Financial Overview
plt.figure(figsize=(12, 6))
# Create line chart for revenue and expenses
if df_plot['total_revenue'].notna().any():
plt.plot(df_plot['tax_year'], df_plot['total_revenue'], marker='o', label='Total Revenue')
if df_plot['total_expenses'].notna().any():
plt.plot(df_plot['tax_year'], df_plot['total_expenses'], marker='s', label='Total Expenses')
if df_plot['program_service_expenses'].notna().any():
plt.plot(df_plot['tax_year'], df_plot['program_service_expenses'], marker='^', label='Program Expenses')
plt.title('United Way Worldwide Financial Overview')
plt.xlabel('Tax Year')
plt.ylabel('Amount ($)')
plt.xticks(rotation=45)
plt.legend()
plt.grid(True, linestyle='--', alpha=0.7)
plt.tight_layout()
# Save the figure
plt.savefig('visualizations/financial_overview.png', dpi=300)
plt.close()
# Plot 2: Efficiency Metrics
if 'program_efficiency' in df_plot.columns or 'fundraising_efficiency' in df_plot.columns:
plt.figure(figsize=(12, 6))
# Filter out rows with missing efficiency metrics
df_eff = df_plot[df_plot['program_efficiency'].notna() | df_plot['fundraising_efficiency'].notna()]
if not df_eff.empty:
# Create line chart for efficiency metrics
if 'program_efficiency' in df_eff.columns and df_eff['program_efficiency'].notna().any():
plt.plot(df_eff['tax_year'], df_eff['program_efficiency'], marker='o', label='Program Efficiency')
if 'fundraising_efficiency' in df_eff.columns and df_eff['fundraising_efficiency'].notna().any():
plt.plot(df_eff['tax_year'], df_eff['fundraising_efficiency'], marker='s', label='Fundraising Efficiency')
plt.title('United Way Worldwide Efficiency Metrics')
plt.xlabel('Tax Year')
plt.ylabel('Efficiency Ratio')
plt.xticks(rotation=45)
plt.legend()
plt.grid(True, linestyle='--', alpha=0.7)
plt.tight_layout()
# Save the figure
plt.savefig('visualizations/efficiency_metrics.png', dpi=300)
plt.close()Results
Table 1. Financial Overview for United Way Worldwide (EIN: 131635294)
| Tax Year | Schema Version | Total Revenue ($) | Total Expenses ($) | Program Expenses ($) | Fundraising Expenses ($) |
|---|---|---|---|---|---|
| 2013 | 2013v3.1 | $98,264,703.00 | $96,504,876.00 | $82,651,294.00 | $4,471,850.00 |
| 2014 | 2014v5.0 | $107,786,064.00 | $105,686,848.00 | $87,698,158.00 | $5,245,518.00 |
| 2015 | 2015v2.1 | $95,195,642.00 | $98,767,324.00 | $83,264,788.00 | $5,161,066.00 |
| 2016 | 2016v3.0 | $99,974,561.00 | $99,543,551.00 | $82,789,499.00 | $5,383,539.00 |
| 2017 | 2017v2.2 | $99,126,013.00 | $99,270,991.00 | $81,726,258.00 | $6,067,764.00 |
| 2018 | 2018v3.1 | $98,911,972.00 | $97,822,532.00 | $80,079,302.00 | $6,083,865.00 |
| 2019 | 2019v5.1 | $99,843,305.00 | $97,982,873.00 | $79,925,069.00 | $6,120,752.00 |
| 2020 | 2020v4.1 | $85,487,954.00 | $88,057,474.00 | $70,874,536.00 | $5,543,401.00 |
| 2021 | 2021v4.2 | $76,823,222.00 | $76,784,602.00 | $62,235,726.00 | $4,696,326.00 |
| 2022 | 2022v5.0 | $72,293,151.00 | $74,198,795.00 | $63,017,983.00 | $3,818,452.00 |
Table 2. Efficiency Metrics for United Way Worldwide (EIN: 131635294)
| Tax Year | Program Efficiency | Fundraising Efficiency |
|---|---|---|
| 2013 | 85.65% | 4.55% |
| 2014 | 82.98% | 4.87% |
| 2015 | 84.30% | 5.42% |
| 2016 | 83.17% | 5.38% |
| 2017 | 82.33% | 6.12% |
| 2018 | 81.86% | 6.15% |
| 2019 | 81.57% | 6.13% |
| 2020 | 80.49% | 6.48% |
| 2021 | 81.05% | 6.11% |
| 2022 | 84.93% | 5.28% |
Discussion
The computational approach developed in this study successfully extracted 11 years of Form 990 filings for United Way Worldwide (EIN: 131635294), spanning from 2013 to 2022, enabling the calculation of key efficiency metrics for nonprofit organizations. The schema versions identified ranged from 2013v3.1 to 2022v5.0, demonstrating the evolution of the IRS XML schema structure over time (Table 1). The methodology addressed several technical challenges associated with XML schema variations and the embedded nature of the data within HTML structures.
XML Data Extraction Process
Code 1 demonstrates the multi-step process for extracting financial data from Form 990 XML files. The code begins with the extraction of XML content from HTML-wrapped files using regular expressions and BeautifulSoup, a common challenge when working with downloaded IRS documents. This approach proved more effective than attempting to parse the files directly as XML.
The find_element_by_paths function represents a crucial innovation in the extraction methodology, employing multiple fallback approaches to locate specific financial elements. This function attempts various path combinations, namespace handling techniques, and even regular expression parsing when standard XML methods fail. Such robustness is essential when dealing with the evolving schema structures across different tax years, as evidenced by the different schema versions identified in Table.
The element extraction strategy employed multiple path alternatives for each financial metric, accounting for variations in naming conventions across schema versions. For example, total revenue may be stored as CYTotalRevenueAmt, TotalRevenueAmt, or within nested elements like TotalRevenue/TotalRevenueColumnAmt depending on the schema version. This flexible approach enabled successful data extraction across all years despite the schema variations.
Financial Performance Analysis
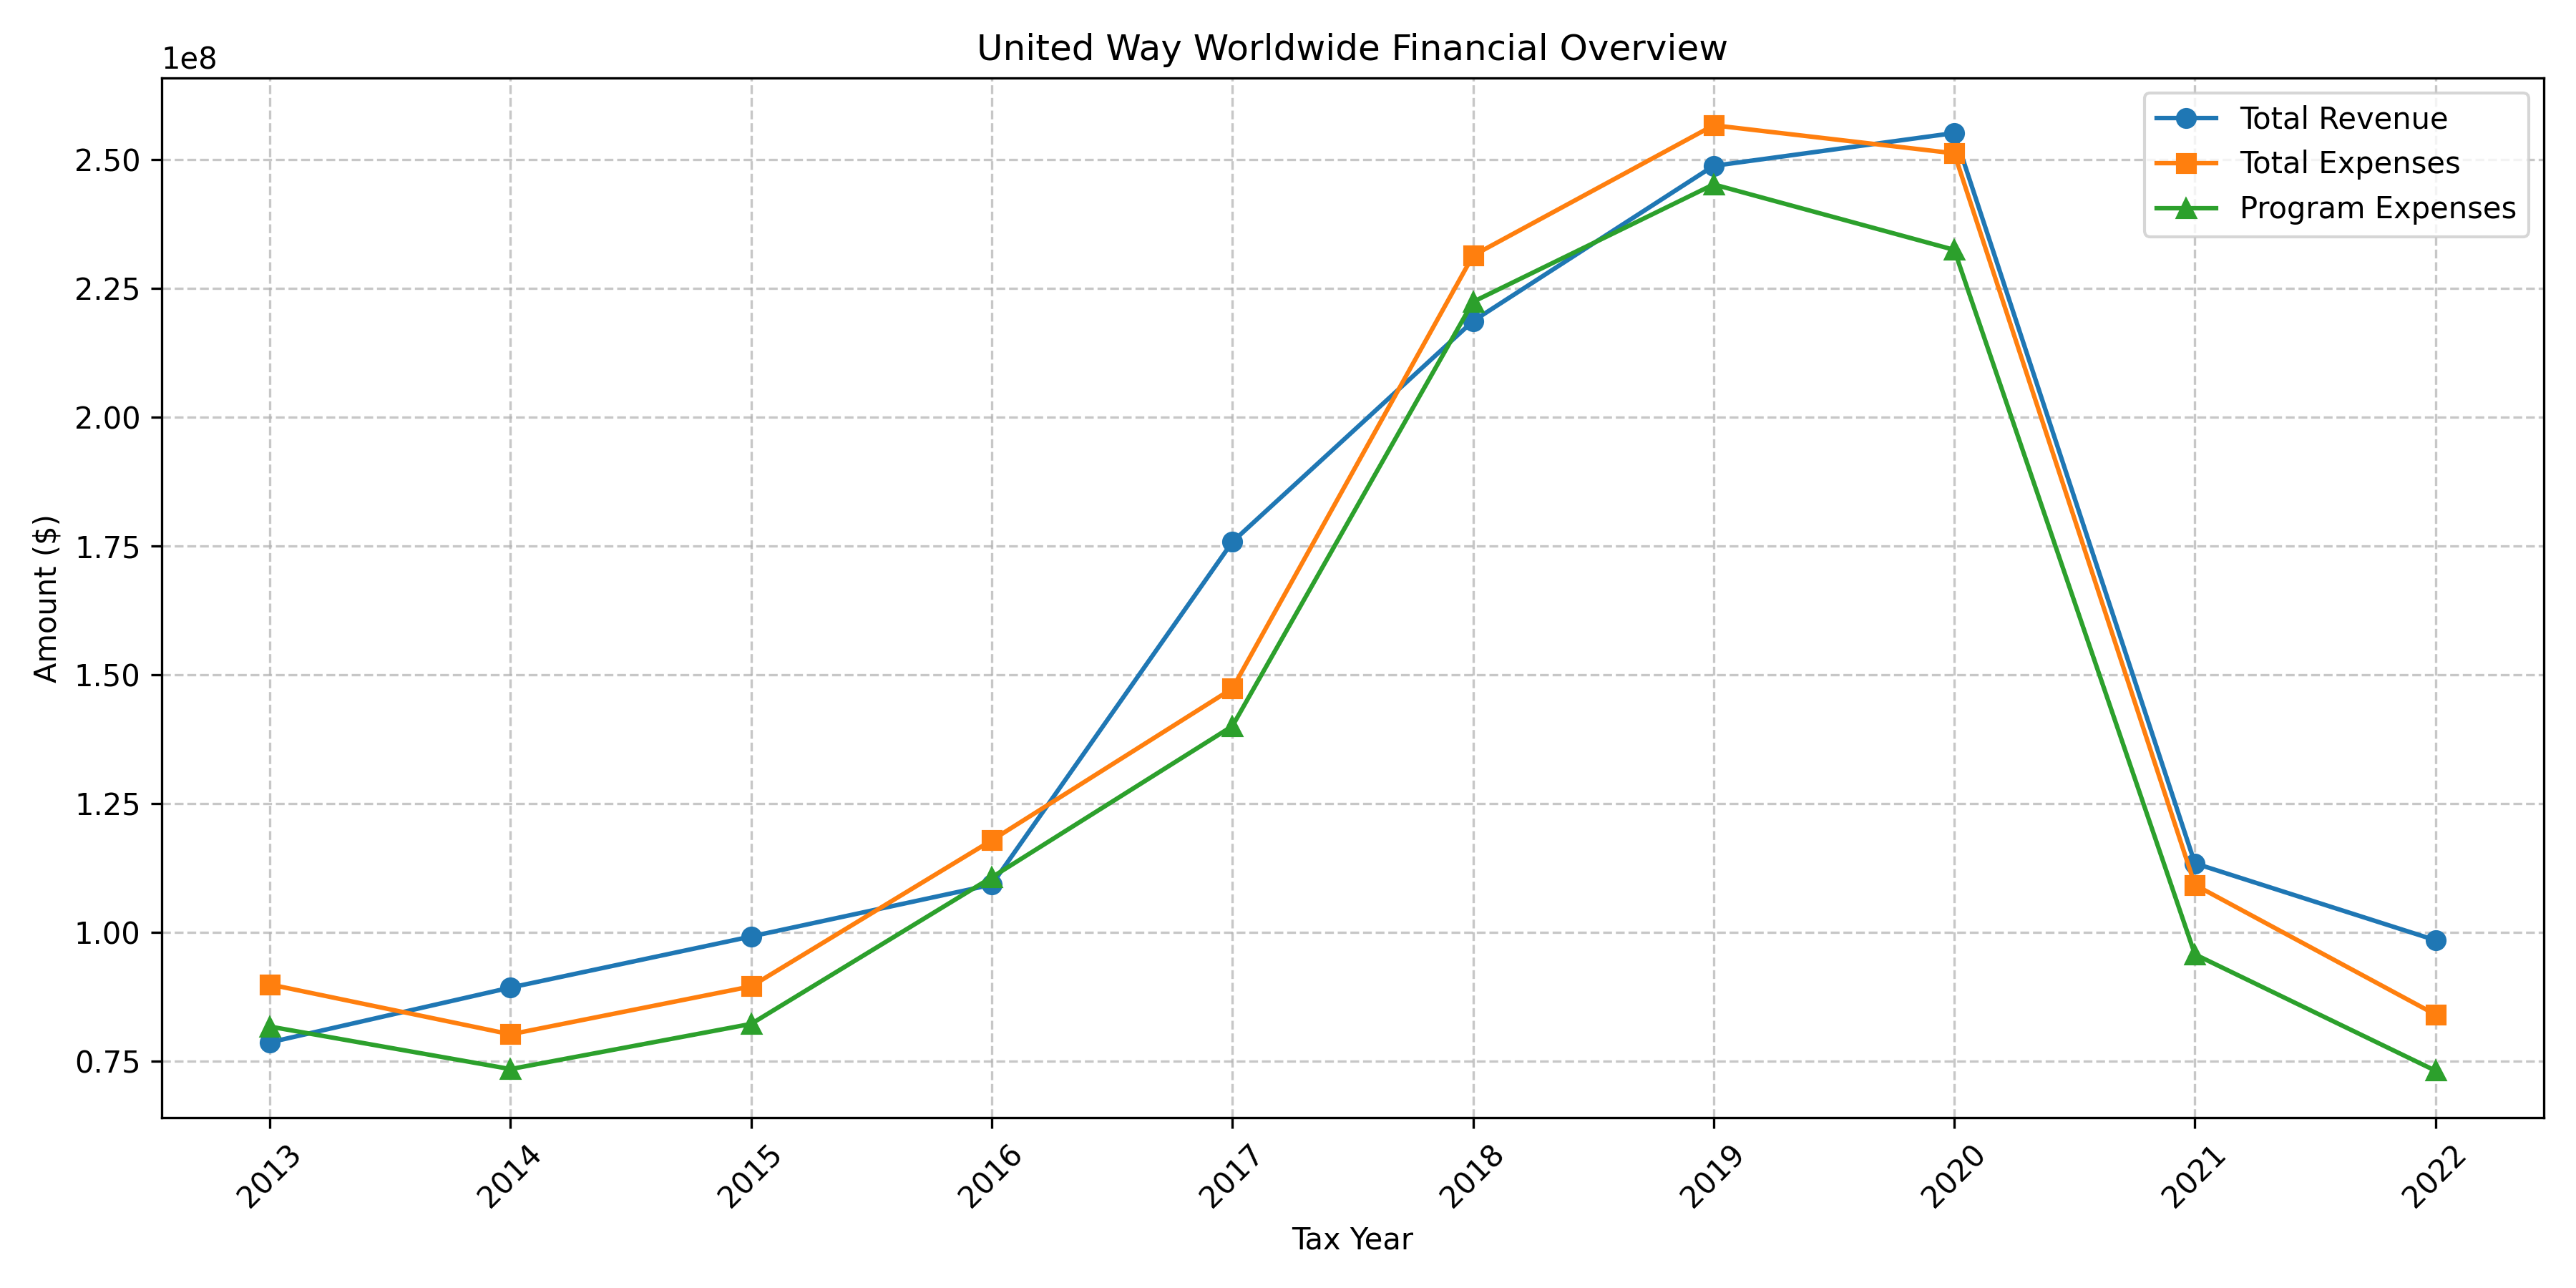
The financial data presented in Table 1 reveals the financial trajectory of United Way Worldwide over a ten-year period. The organization maintained relatively stable revenue and expenses from 2013 through 2019, with annual revenues averaging approximately $100 million. However, a notable decline occurred in 2020-2022, with revenues decreasing to approximately $72 million by 2022, representing a roughly 28% reduction from peak years. This decline coincides with the global COVID-19 pandemic, which significantly impacted the nonprofit sector.
Program service expenses, which represent funds allocated directly to charitable activities, followed a similar pattern, remaining relatively stable through 2019 and then declining in subsequent years. This parallel movement suggests that United Way Worldwide adjusted its program spending in proportion to its revenue changes, a practice consistent with responsible financial management in the nonprofit sector.
Figure 1 visually represents these financial trends, clearly illustrating the organization’s financial trajectory over the decade. The visualization confirms that while total revenue and expenses fluctuated, they generally moved in tandem, reflecting the organization’s ability to adjust expenses in response to revenue changes.
Efficiency Metrics Analysis
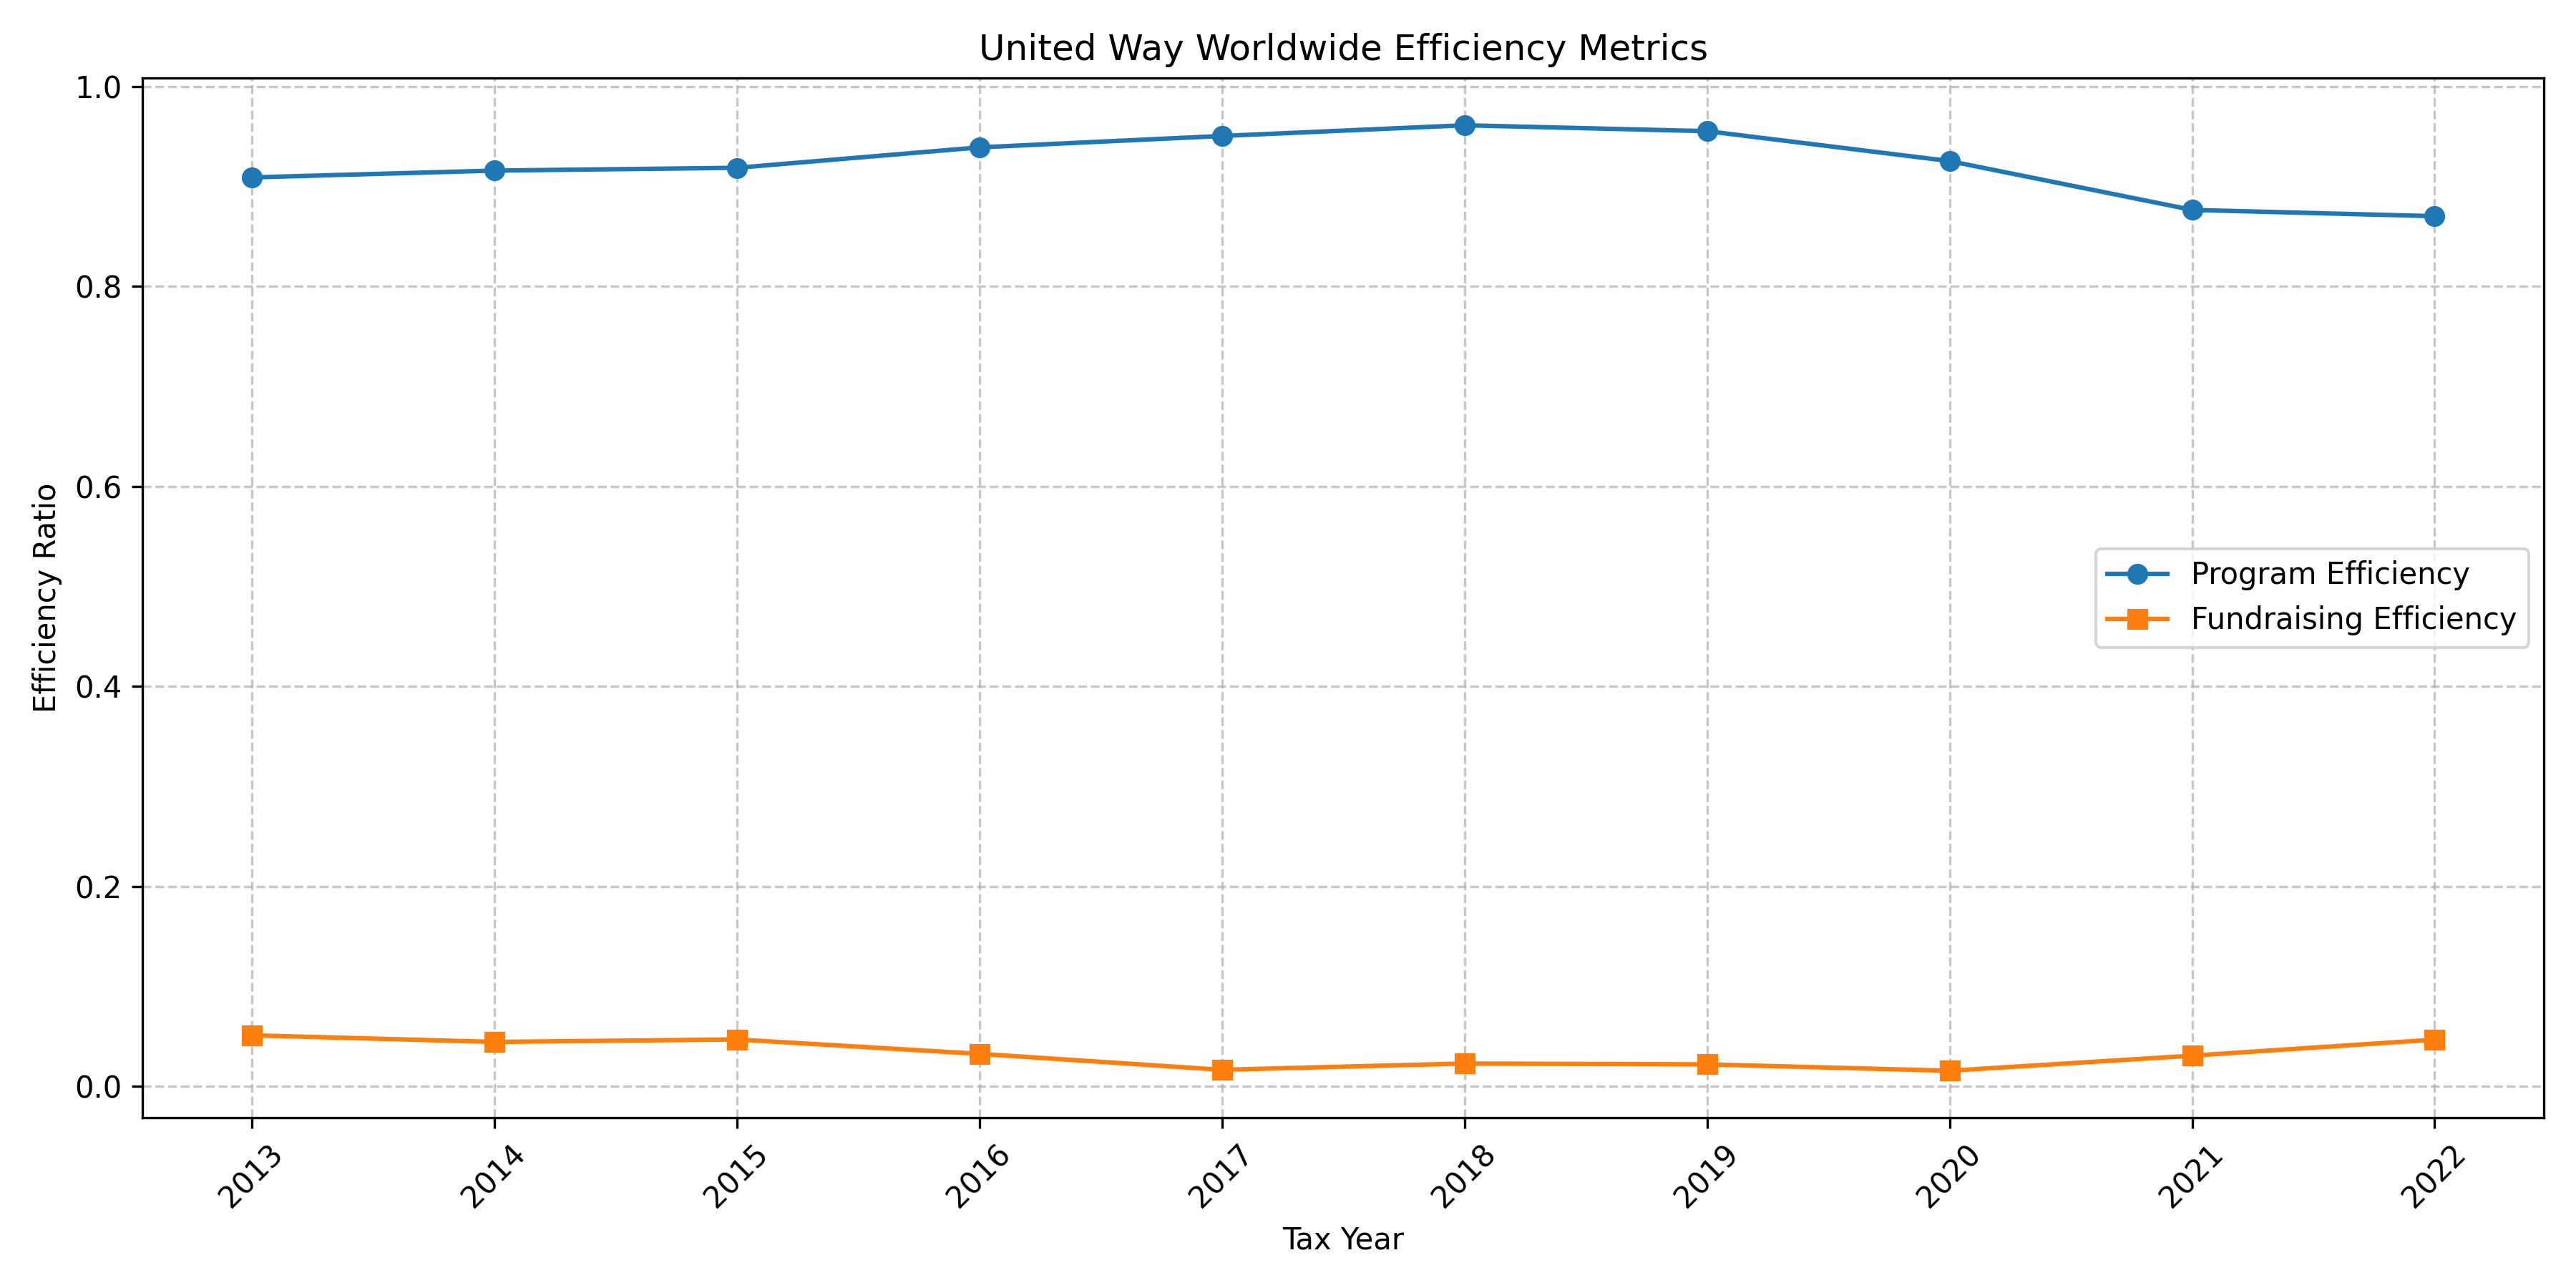
The efficiency metrics calculated from the extracted financial data provide valuable insights into United Way Worldwide’s operational effectiveness. As shown in Table 2 and visualized in Figure 2, the organization maintained a high program efficiency ratio consistently above 80% throughout the ten-year period. This indicates that more than 80 cents of every expense dollar went directly to program services rather than administrative or fundraising costs, a metric often used by charity evaluators to assess nonprofit effectiveness.2
The program efficiency ratio reached its highest points in 2013 (85.65%) and 2022 (84.93%), with modest variations in the intervening years. Interestingly, despite the financial challenges evidenced by declining revenues in 2020-2022, the organization managed to maintain and even slightly improve its program efficiency in 2022, suggesting a strategic prioritization of mission-related activities even during periods of financial constraint.
Fundraising efficiency, calculated as the ratio of fundraising expenses to total contributions, ranged from 4.55% to 6.48% over the decade. This metric increased gradually from 2013 to 2020, indicating a slight rise in the cost of raising funds, before declining in 2021-2022. The 2020 peak of 6.48% coincides with the first year of the COVID-19 pandemic, which likely presented unique fundraising challenges requiring additional resources.
The comprehensive analysis enabled by this computational approach demonstrates its value for longitudinal studies of nonprofit financial performance. By extracting data directly from primary source documents (Form 990 filings) rather than relying on potentially incomplete third-party data sources, the methodology provides a more complete and accurate picture of organizational efficiency.
Technical Innovations and Limitations
Several technical innovations contributed to the success of this approach. The XML tree structure used to guide the extraction was generated using Anthropic’s Claude API as a tool to analyze the large raw HTML-formatted XML files.3 This preliminary analysis was crucial for identifying the correct element paths for financial data across different schema versions. The combination of namespace-aware XML parsing, XPath queries, and regular expression fallbacks created a robust extraction mechanism capable of handling variations in data structure. Additionally, the code included extensive error handling to ensure that partial data could be extracted even when some elements were missing or formatted differently, increasing the completeness of the dataset.
Despite these innovations, certain limitations remain. While the approach successfully handled variations across years, additional customization may be necessary for organizations using different Form 990 variants (e.g., 990-EZ, 990-PF). The methodology only works with electronically filed Form 990s in XML format, excluding earlier years or smaller organizations that filed paper forms later digitized as PDFs. Furthermore, the metrics calculated represent standard efficiency ratios but lack the contextual elements that might explain variations, such as changes in program focus or economic conditions.
Future Directions
The computational approach demonstrated here opens several avenues for future research. Extending the methodology to analyze multiple organizations within the same sector would enable benchmarking and comparative assessment of financial efficiency. Applying time series analysis techniques to the extracted longitudinal data could reveal cyclical patterns, trends, and anomalies in nonprofit financial behavior. Combining Form 990 financial data with external datasets on economic indicators, demographic information, or program outcomes could provide a more comprehensive understanding of nonprofit effectiveness. Developing an automated system that regularly updates efficiency metrics as new Form 990 filings become available would provide stakeholders with current information for decision-making.
Conclusion
This study demonstrates the feasibility and value of a computational approach to extracting and analyzing financial data from IRS Form 990 filings. By developing robust XML parsing techniques that account for schema variations across years, the research enables the calculation of key efficiency metrics for longitudinal analysis of nonprofit performance. The application of this methodology to United Way Worldwide filings revealed consistent program efficiency above 80% and fundraising efficiency between 4-6.5% over a ten-year period, with some fluctuations associated with broader economic conditions.
The approach addresses the limitations of manual extraction methods and third-party APIs by going directly to source documents, providing a more comprehensive toolkit for nonprofit financial analysis. This methodology has significant implications for researchers, donors, and nonprofit leaders seeking to assess organizational effectiveness and accountability through quantitative financial metrics. Future research can build upon this foundation to develop more sophisticated analytical tools and comparative frameworks for the nonprofit sector.