Computational Extraction of Financial Metrics from IRS Form 990 Data Using ProPublica's Nonprofit Explorer API
Introduction
The Internal Revenue Service (IRS) Form 990 is a mandatory annual filing for tax-exempt organizations in the United States, detailing financial performance, governance, and operational activities. These documents contain critical data such as total revenue, program service expenses, and executive compensation, which can be used to compute figures of merit like program efficiency and fundraising efficiency. Program efficiency (PE), defined as the ratio of program service expenses to total expenses, reflects the proportion of funds allocated to mission-related activities. This metric, expressed mathematically as \[\text{Program Efficiency} = \frac{\text{Program Service Expenses}}{\text{Total Expenses}}\], serves as an indicator of how effectively a nonprofit directs its resources towards its stated mission rather than administrative or fundraising overhead. On the IRS Form 990, program service expenses are reported in Part IX (Statement of Functional Expenses), Line 25, Column (B), under the field <ProgramServiceExpenses> in electronic filings or as “Program services” in the tabular breakdown. Total expenses are similarly reported in Part IX, Line 25, Column (A), denoted as <TotalExpenses> or “Total functional expenses.” A high PE, typically above 0.75 (75%), suggests an organization in which the majority of funds support programmatic goals—e.g., a charity delivering direct aid or services. Conversely, a low ratio, such as below 0.50 (50%), may indicate an organization in which excessive spending on administration or fundraising dilutes mission impact. For example, an organization with $800,000 in program expenses and $1,000,000 in total expenses yields a PE of 0.80, signaling strong mission focus, whereas $400,000 in program expenses against $1,000,000 total expenses results in 0.40, raising concerns about resource allocation. Industry benchmarks often recommend a threshold of 0.65 to 0.85 for well-managed nonprofits, though context—such as organization size or mission type—may adjust these expectations.1
Fundraising efficiency (FE), expressed as total contributions divided by fundraising expenses, measures the effectiveness of fundraising efforts. Calculated as \[\text{Fundraising Efficiency} = \frac{\text{Total Contributions}}{\text{Fundraising Expenses}}\], this metric evaluates the return on investment for fundraising activities, highlighting how much revenue is generated per dollar spent. On the Form 990, total contributions are found in Part VIII (Statement of Revenue), Line 1h, Column (A), under <TotalContributions> or “Contributions, gifts, grants, and similar amounts received,” encompassing donations and grants. Fundraising expenses are detailed in Part IX, Line 25, Column (D), as <FundraisingExpenses> or “Fundraising” in the expense breakdown. A high FE, such as 10.0 (indicating $10 raised per $1 spent), characterizes an organization with cost-effective donor outreach—e.g., a nonprofit raising $500,000 from $50,000 in fundraising costs. A low value, such as 1.0 ($100,000 raised from $100,000 spent), indicates an organization where fundraising consumes disproportionate resources, potentially signaling inefficiency or reliance on expensive campaigns. Values below 2.0 often draw scrutiny, though norms vary by sector; large-scale disaster relief entities might tolerate lower ratios due to urgent, high-cost drives, while grassroots groups aim higher. ProPublica’s API typically maps these fields as <totrev> (revenue, including contributions) and <fundraising> (expenses), requiring careful disaggregation to isolate contributions specifically.
Metrics like PE and FE are invaluable for volunteers and professionals evaluating nonprofit organizations as potential employers or partners, yet accessing this data programmatically remains challenging. Form 990 filings exhibit significant variability in format and availability. Pre-2019 submissions are predominantly Portable Document Format (PDF) files, often containing scanned images rather than machine-readable text, while post-2019 electronic filings provide Extensible Markup Language (XML) data through the IRS. Third-party resources, notably ProPublica’s Nonprofit Explorer, offer an application programming interface (API) to access a subset of electronic 990s, though coverage is incomplete and field consistency varies. The API, accessible at https://projects.propublica.org/nonprofits/api, returns data in JavaScript Object Notation (JSON) format, requiring parsing to isolate relevant entries.2 Prior work at https://search.noprofits.org/ demonstrates basic API retrieval using JavaScript but lacks depth in metric calculation.3
This experiment builds on that JavaScript search tool, available at https://github.com/noprofits-org/search, adapting its query logic to Python for enhanced processing capabilities.4 We selected a diverse sample of influential nonprofit organizations representing different sectors of civil society to test our extraction methodology. The American Civil Liberties Union Foundation (ACLU, EIN 13-6213516) was chosen for its prominence in legal advocacy and civil rights work, representing organizations focused on policy change rather than direct service delivery. The American Red Cross (EIN 53-0196605) represents large-scale disaster relief and humanitarian organizations with complex operations and significant public visibility. United Way Worldwide (EIN 13-1635294) was selected as a major federated fundraising organization that distributes resources to numerous community partners, providing insight into intermediary nonprofit structures. Planned Parenthood Federation of America (EIN 13-1644147) represents healthcare-focused nonprofits that combine service delivery with advocacy, offering a hybrid operational model for analysis. The Nature Conservancy (EIN 53-0242652) provides perspective on environmental conservation organizations that often manage significant land assets alongside programming expenses. These organizations were also selected based on data availability within ProPublica’s dataset, allowing for more complete analysis of their financial metrics.
Our methodology handles potential inconsistencies in field naming (e.g., <total_revenue> vs. <totrev>), logging successes and failures to assess reliability. The central aim of this study is to develop a reproducible methodology for programmatically extracting financial metrics from Form 990 data while evaluating the reliability and completeness of the ProPublica API as a data source. We seek to create a user-friendly interface for accessing and analyzing nonprofit financial data, identify challenges and limitations in automated Form 990 data extraction, and provide a foundation for more sophisticated nonprofit financial analysis tools. Through this work, we hope to improve transparency and accessibility of nonprofit financial data, enabling better-informed decisions by donors, volunteers, and other stakeholders in the nonprofit sector.
Experimental
# Navigate to your project directory
# Create a virtual environment named 'venv'
python3 -m venv venv
# Activate the virtual environment
source venv/bin/activate# Create requirements.txt file
cat > requirements.txt << 'EOF'
requests>=2.28.0
pandas>=1.5.0
matplotlib>=3.6.0
rich>=12.0.0
EOF# Install dependencies
pip install -r requirements.txt#!/usr/bin/env python3
"""
Nonprofit Financial Analyzer
A tool for extracting and analyzing financial metrics from IRS Form 990 data
using the ProPublica Nonprofit Explorer API.
This module extracts Program Efficiency (PE) and Fundraising Efficiency (FE)
metrics for selected nonprofit organizations across multiple years of available
filings, handling varying data formats and availability.
"""
import os
import sys
import json
import time
import logging
from typing import Dict, List, Optional, Tuple, Union, Any
from dataclasses import dataclass
from datetime import datetime
from pathlib import Path
import concurrent.futures
import requests
import pandas as pd
import matplotlib.pyplot as plt
from rich.console import Console
from rich.table import Table
from rich.progress import Progress, SpinnerColumn, TextColumn, BarColumn, TimeElapsedColumn
# Setup logging
logging.basicConfig(
level=logging.INFO,
format='%(asctime)s - %(name)s - %(levelname)s - %(message)s',
handlers=[
logging.FileHandler("nonprofit_analyzer.log"),
logging.StreamHandler(sys.stdout)
]
)
logger = logging.getLogger(__name__)
# Rich console for pretty output
console = Console()
# Constants
BASE_URL = "https://projects.propublica.org/nonprofits/api/v2/organizations/"
CACHE_DIR = Path("cache")
RESULTS_DIR = Path("results")
CHARTS_DIR = RESULTS_DIR / "charts"
# Ensure directories exist
CACHE_DIR.mkdir(exist_ok=True, parents=True)
RESULTS_DIR.mkdir(exist_ok=True, parents=True)
CHARTS_DIR.mkdir(exist_ok=True, parents=True)
@dataclass
class Organization:
"""Represents a nonprofit organization with identification and basic info."""
ein: str
name: str = ""
ntee_code: str = "" # National Taxonomy of Exempt Entities code
classification: str = ""
def cache_path(self) -> Path:
"""Returns the path to the cache file for this organization."""
return CACHE_DIR / f"{self.ein}.json"
@dataclass
class FinancialMetrics:
"""Financial metrics extracted from Form 990 data."""
year: int
total_revenue: Optional[float] = None
total_expenses: Optional[float] = None
program_expenses: Optional[float] = None
fundraising_expenses: Optional[float] = None
admin_expenses: Optional[float] = None
total_contributions: Optional[float] = None
total_assets: Optional[float] = None
filing_type: str = ""
data_source: str = "ProPublica API"
@property
def program_efficiency(self) -> Optional[float]:
"""Calculate program efficiency if required data is available."""
if self.program_expenses is not None and self.total_expenses is not None and self.total_expenses > 0:
return self.program_expenses / self.total_expenses
return None
@property
def fundraising_efficiency(self) -> Optional[float]:
"""Calculate fundraising efficiency if required data is available."""
# If total_contributions is not available, use total_revenue as fallback
contributions = self.total_contributions or self.total_revenue
if contributions is not None and self.fundraising_expenses is not None and self.fundraising_expenses > 0:
return contributions / self.fundraising_expenses
return None
@property
def admin_ratio(self) -> Optional[float]:
"""Calculate administrative expenses ratio if required data is available."""
if self.admin_expenses is not None and self.total_expenses is not None and self.total_expenses > 0:
return self.admin_expenses / self.total_expenses
return None
def to_dict(self) -> Dict[str, Any]:
"""Convert to dictionary for serialization and DataFrame creation."""
return {
"Year": self.year,
"Total Revenue": self.total_revenue,
"Total Expenses": self.total_expenses,
"Program Expenses": self.program_expenses,
"Fundraising Expenses": self.fundraising_expenses,
"Admin Expenses": self.admin_expenses,
"Total Contributions": self.total_contributions,
"Total Assets": self.total_assets,
"Program Efficiency": self.program_efficiency,
"Fundraising Efficiency": self.fundraising_efficiency,
"Admin Ratio": self.admin_ratio,
"Filing Type": self.filing_type,
"Data Source": self.data_source
}
class NonprofitAnalyzer:
"""Main class for analyzing nonprofit financial data from Form 990 filings."""
def __init__(self, use_cache: bool = True, rate_limit: float = 0.5):
"""
Initialize the analyzer.
Args:
use_cache: Whether to use cached API responses
rate_limit: Minimum time between API requests in seconds
"""
self.use_cache = use_cache
self.rate_limit = rate_limit
self.last_request_time = 0
self.http_session = requests.Session()
# Define organizations of interest from the paper introduction
# These are verified EINs for the specific organizations
self.organizations = [
Organization(ein="13-6213516", name="American Civil Liberties Union Foundation"),
Organization(ein="53-0196605", name="American National Red Cross"),
Organization(ein="13-1635294", name="United Way Worldwide"),
Organization(ein="13-1644147", name="Planned Parenthood Federation of America"),
Organization(ein="53-0242652", name="Nature Conservancy")
]
def _respect_rate_limit(self):
"""Ensure we don't exceed the API rate limit."""
elapsed = time.time() - self.last_request_time
if elapsed < self.rate_limit:
time.sleep(self.rate_limit - elapsed)
self.last_request_time = time.time()
def fetch_organization_data(self, org: Organization) -> Dict[str, Any]:
"""
Fetch data for an organization from the ProPublica API or cache.
Args:
org: The organization to fetch data for
Returns:
Dictionary containing the organization data
"""
cache_path = org.cache_path()
# Check cache first if enabled
if self.use_cache and cache_path.exists():
try:
with open(cache_path, 'r') as f:
logger.info(f"Loading cached data for {org.ein}")
return json.load(f)
except (json.JSONDecodeError, IOError) as e:
logger.warning(f"Error reading cache for {org.ein}: {e}")
# Continue to fetch from API if cache read fails
# Fetch from API with rate limiting
self._respect_rate_limit()
url = f"{BASE_URL}{org.ein}.json"
try:
logger.info(f"Fetching data for {org.ein} from ProPublica API")
response = self.http_session.get(url)
response.raise_for_status()
data = response.json()
# Update organization name if available
if "organization" in data and "name" in data["organization"]:
org.name = data["organization"]["name"]
if "ntee_code" in data["organization"]:
org.ntee_code = data["organization"]["ntee_code"]
if "subsection" in data["organization"]:
org.classification = data["organization"]["subsection"]
# Cache the response
if self.use_cache:
with open(cache_path, 'w') as f:
json.dump(data, f, indent=2)
return data
except requests.RequestException as e:
logger.error(f"Error fetching data for {org.ein}: {e}")
return {}
def extract_financial_metrics(self, org_data: Dict[str, Any]) -> Dict[int, FinancialMetrics]:
"""
Extract financial metrics from organization data.
Args:
org_data: Organization data from ProPublica API
Returns:
Dictionary of financial metrics by year
"""
metrics_by_year = {}
if not org_data or "filings_with_data" not in org_data:
return metrics_by_year
filings = org_data.get("filings_with_data", [])
for filing in filings:
try:
# Extract year - Handle the tax_prd_yr field specifically
if "tax_prd_yr" in filing:
year = int(filing["tax_prd_yr"])
logger.info(f"Successfully parsed year: {year}")
else:
# Try fallback methods if tax_prd_yr is missing
year_str = filing.get("tax_prd", filing.get("tax_period", ""))
logger.debug(f"Trying to parse year from alternative field: {year_str}")
try:
# Try to parse year from different formats
if len(year_str) == 4: # Just the year
year = int(year_str)
elif len(year_str) == 6: # YYYYMM format
year = int(year_str[:4])
elif "-" in year_str: # YYYY-MM-DD format
year = int(year_str.split("-")[0])
else:
logger.warning(f"Unrecognized year format: {year_str}")
continue
except (ValueError, TypeError):
logger.warning(f"Could not parse year from: {year_str}")
continue
# Extract filing type
filing_type = filing.get("FormType", filing.get("formtype_str", filing.get("formtype", "Unknown")))
if filing_type == 0:
filing_type = "990" # Convert numeric code to string representation
# Extract program service expenses - try multiple possible field names
program_expenses = self._extract_float(filing, [
"progsrvcexpns", "progservexp", "program_expenses",
"programserviceexpenses", "program_service_expenses"
])
# Extract total expenses
total_expenses = self._extract_float(filing, [
"totfuncexpns", "totfuncexp", "total_expenses",
"totalfunctionalexpenses", "total_functional_expenses"
])
# Extract fundraising expenses
fundraising_expenses = self._extract_float(filing, [
"fundraisingexpns", "fundraising", "fundraising_expenses",
"profndraising" # Some filings use this for professional fundraising fees
])
# Extract total contributions
total_contributions = self._extract_float(filing, [
"totcntrbgfts", "contributions", "total_contributions",
"contributionsgrantsetc"
])
# Extract total revenue
total_revenue = self._extract_float(filing, [
"totrevenue", "totrev", "total_revenue"
])
# Calculate administrative expenses if not directly provided
admin_expenses = None
if total_expenses is not None and program_expenses is not None:
if fundraising_expenses is not None:
admin_expenses = total_expenses - program_expenses - fundraising_expenses
else:
# If fundraising expenses are missing, we can only calculate admin+fundraising combined
admin_expenses = total_expenses - program_expenses
# Create metrics object
metrics = FinancialMetrics(
year=year,
filing_type=filing_type,
total_revenue=total_revenue,
total_expenses=total_expenses,
program_expenses=program_expenses,
fundraising_expenses=fundraising_expenses,
admin_expenses=admin_expenses,
total_contributions=total_contributions,
total_assets=self._extract_float(filing, ["totassetsend", "total_assets", "totassets"])
)
# Check if required fields for efficiency calculations exist
if metrics.program_efficiency is None:
logger.warning(
f"Cannot calculate Program Efficiency for {year}: "
f"program_expenses={program_expenses}, total_expenses={total_expenses}"
)
if metrics.fundraising_efficiency is None:
contributions = total_contributions or total_revenue
logger.warning(
f"Cannot calculate Fundraising Efficiency for {year}: "
f"contributions={contributions}, fundraising_expenses={fundraising_expenses}"
)
metrics_by_year[year] = metrics
except Exception as e:
logger.error(f"Error processing filing: {e}")
continue
return metrics_by_year
def _extract_float(self, data: Dict[str, Any], possible_keys: List[str]) -> Optional[float]:
"""
Extract a float value from a dictionary trying multiple potential keys.
Args:
data: Dictionary to extract from
possible_keys: List of potential keys to try
Returns:
Float value if found, None otherwise
"""
for key in possible_keys:
if key in data and data[key] is not None:
try:
# Handle the case where the value might be a string with commas
value = data[key]
if isinstance(value, str):
value = value.replace(',', '')
return float(value)
except (ValueError, TypeError) as e:
logger.debug(f"Could not convert {key}={data[key]} to float: {e}")
pass
return None
def analyze_all_organizations(self) -> Dict[str, Dict[int, FinancialMetrics]]:
"""
Analyze all predefined organizations.
Returns:
Dictionary mapping EINs to dictionaries of metrics by year
"""
results = {}
with Progress(
SpinnerColumn(),
TextColumn("[progress.description]{task.description}"),
BarColumn(),
TimeElapsedColumn()
) as progress:
task = progress.add_task("[green]Analyzing organizations...", total=len(self.organizations))
for org in self.organizations:
org_data = self.fetch_organization_data(org)
metrics = self.extract_financial_metrics(org_data)
results[org.ein] = metrics
# Log successful extraction
if metrics:
years = sorted(metrics.keys())
logger.info(f"Successfully extracted metrics for {org.name} for years: {years}")
else:
logger.warning(f"No financial metrics could be extracted for {org.name}")
progress.update(task, advance=1, description=f"[green]Analyzed {org.name}")
return results
def generate_reports(self, results: Dict[str, Dict[int, FinancialMetrics]]):
"""
Generate reports from analysis results.
Args:
results: Analysis results by organization and year
"""
self._generate_csv_reports(results)
self._generate_summary_table(results)
self._generate_charts(results)
def _generate_csv_reports(self, results: Dict[str, Dict[int, FinancialMetrics]]):
"""Generate CSV reports for each organization."""
for ein, metrics_by_year in results.items():
if not metrics_by_year:
continue
org = next((o for o in self.organizations if o.ein == ein), None)
org_name = org.name if org else ein
# Convert metrics to DataFrame
data = [metrics.to_dict() for metrics in metrics_by_year.values()]
if not data:
logger.warning(f"No data to create CSV report for {org_name}")
continue
df = pd.DataFrame(data)
# Sort by year
if not df.empty:
df = df.sort_values(by="Year")
# Save to CSV
safe_name = "".join(c if c.isalnum() else "_" for c in org_name)
csv_path = RESULTS_DIR / f"{ein}_{safe_name}.csv"
df.to_csv(csv_path, index=False)
logger.info(f"Saved CSV report to {csv_path}")
def _generate_summary_table(self, results: Dict[str, Dict[int, FinancialMetrics]]):
"""Generate a summary table of the most recent metrics for each organization."""
table = Table(title="Nonprofit Financial Metrics - Most Recent Year")
# Add columns
table.add_column("Organization", style="cyan")
table.add_column("Year", style="green")
table.add_column("Program Efficiency", style="magenta")
table.add_column("Fundraising Efficiency", style="yellow")
table.add_column("Form Type", style="blue")
# Add rows for each organization's most recent data
summary_data = []
has_data = False
for ein, metrics_by_year in results.items():
if not metrics_by_year:
continue
org = next((o for o in self.organizations if o.ein == ein), None)
org_name = org.name if org else ein
# Find the most recent year with data
most_recent_year = max(metrics_by_year.keys()) if metrics_by_year else None
if most_recent_year is None:
continue
metrics = metrics_by_year[most_recent_year]
pe = f"{metrics.program_efficiency:.2%}" if metrics.program_efficiency is not None else "N/A"
fe = f"{metrics.fundraising_efficiency:.2f}" if metrics.fundraising_efficiency is not None else "N/A"
table.add_row(
org_name,
str(most_recent_year),
pe,
fe,
metrics.filing_type
)
has_data = True
# Build summary data for CSV export
summary_data.append({
"Organization": org_name,
"EIN": ein,
"Year": most_recent_year,
"Program Efficiency": metrics.program_efficiency,
"Fundraising Efficiency": metrics.fundraising_efficiency,
"Total Revenue": metrics.total_revenue,
"Total Expenses": metrics.total_expenses,
"Form Type": metrics.filing_type
})
# Print the table if we have data
if has_data:
console.print(table)
else:
console.print("[yellow]No recent financial metrics available to display.[/yellow]")
# Save summary data as CSV for later use
if summary_data:
df = pd.DataFrame(summary_data)
df.to_csv(RESULTS_DIR / "summary.csv", index=False)
logger.info("Summary data saved to results/summary.csv")
def _generate_charts(self, results: Dict[str, Dict[int, FinancialMetrics]]):
"""Generate charts visualizing metrics over time."""
# Check if we have any data to chart
has_data = any(bool(metrics) for metrics in results.values())
if not has_data:
logger.warning("No data available to generate charts.")
return
# 1. Program Efficiency Over Time (All Organizations)
self._create_efficiency_chart(results, "program_efficiency", "Program Efficiency Over Time",
"Program Efficiency (Program Expenses / Total Expenses)",
"program_efficiency_chart.png")
# 2. Fundraising Efficiency Over Time (All Organizations)
self._create_efficiency_chart(results, "fundraising_efficiency", "Fundraising Efficiency Over Time",
"Fundraising Efficiency (Contributions / Fundraising Expenses)",
"fundraising_efficiency_chart.png")
# 3. Individual organization charts
for ein, metrics_by_year in results.items():
if not metrics_by_year or len(metrics_by_year) < 2: # Need at least 2 years for a meaningful chart
continue
org = next((o for o in self.organizations if o.ein == ein), None)
org_name = org.name if org else ein
self._create_organization_chart(ein, org_name, metrics_by_year)
def _create_efficiency_chart(self, results: Dict[str, Dict[int, FinancialMetrics]],
metric_name: str, title: str, ylabel: str, filename: str):
"""Create a chart showing an efficiency metric over time for all organizations."""
plt.figure(figsize=(12, 6))
has_data = False
for ein, metrics_by_year in results.items():
if not metrics_by_year:
continue
org = next((o for o in self.organizations if o.ein == ein), None)
org_name = org.name if org else ein
years = []
values = []
for year, metrics in sorted(metrics_by_year.items()):
metric_value = getattr(metrics, metric_name)
if metric_value is not None:
years.append(year)
values.append(metric_value)
if years: # Only plot if we have data
plt.plot(years, values, marker='o', label=org_name)
has_data = True
# Only create chart if we have data
if has_data:
plt.title(title)
plt.xlabel("Year")
plt.ylabel(ylabel)
plt.grid(True, linestyle='--', alpha=0.7)
plt.legend()
plt.tight_layout()
# Save the chart
plt.savefig(CHARTS_DIR / filename, dpi=300)
logger.info(f"Generated chart: {filename}")
else:
logger.warning(f"No data available to create {title} chart")
plt.close()
def _create_organization_chart(self, ein: str, org_name: str, metrics_by_year: Dict[int, FinancialMetrics]):
"""Create a chart showing multiple metrics for a single organization."""
years = sorted(metrics_by_year.keys())
# Extract metrics
pe_values = [metrics_by_year[year].program_efficiency if metrics_by_year[year].program_efficiency is not None else None for year in years]
fe_values = [metrics_by_year[year].fundraising_efficiency if metrics_by_year[year].fundraising_efficiency is not None else None for year in years]
admin_values = [metrics_by_year[year].admin_ratio if metrics_by_year[year].admin_ratio is not None else None for year in years]
# Skip if we don't have enough data
if not any(pe_values) and not any(fe_values) and not any(admin_values):
logger.warning(f"No efficiency metrics available for {org_name}")
return
# Create the chart
plt.figure(figsize=(12, 6))
# Create the primary axis for Program Efficiency and Admin Ratio (0-1 scale)
ax1 = plt.gca()
ax1.set_xlabel("Year")
ax1.set_ylabel("Ratio (0-1 scale)")
ax1.set_ylim(0, 1)
# Plot Program Efficiency and Admin Ratio on primary axis
has_data = False
if any(pe_values):
ax1.plot(years, [v if v is not None else float('nan') for v in pe_values],
marker='o', color='blue', label="Program Efficiency")
has_data = True
if any(admin_values):
ax1.plot(years, [v if v is not None else float('nan') for v in admin_values],
marker='s', color='red', label="Admin Ratio")
has_data = True
# Create secondary axis for Fundraising Efficiency (potentially larger scale)
if any(fe_values):
ax2 = ax1.twinx()
ax2.set_ylabel("Fundraising Efficiency", color='green')
# Filter out None values for max calculation
valid_fe = [v for v in fe_values if v is not None]
max_fe = max(valid_fe) if valid_fe else 10
ax2.set_ylim(0, max(20, max_fe * 1.2)) # Set upper limit to at least 20
ax2.plot(years, [v if v is not None else float('nan') for v in fe_values],
marker='^', color='green', label="Fundraising Efficiency")
ax2.tick_params(axis='y', labelcolor='green')
has_data = True
# Add Fundraising Efficiency to legend on primary axis
from matplotlib.lines import Line2D
fe_line = Line2D([0], [0], color='green', marker='^', label="Fundraising Efficiency")
ax1_handles, ax1_labels = ax1.get_legend_handles_labels()
ax1.legend(handles=ax1_handles + [fe_line], labels=ax1_labels + ["Fundraising Efficiency"])
else:
ax1.legend()
# Only create chart if we have data
if has_data:
plt.title(f"Financial Metrics Over Time: {org_name}")
plt.grid(True, linestyle='--', alpha=0.7)
plt.tight_layout()
# Create a safe filename
safe_name = "".join(c if c.isalnum() else "_" for c in org_name)
filename = f"{ein}_{safe_name}_metrics.png"
# Save the chart
plt.savefig(CHARTS_DIR / filename, dpi=300)
logger.info(f"Generated organization chart: {filename}")
else:
logger.warning(f"No metrics data available to create chart for {org_name}")
plt.close()
def main():
"""Main function to run the nonprofit analyzer."""
console.print("[bold green]Nonprofit Financial Analyzer[/bold green]")
console.print("Extracting and analyzing Form 990 data from ProPublica API")
console.print()
try:
# Initialize and run the analyzer
analyzer = NonprofitAnalyzer(use_cache=True)
results = analyzer.analyze_all_organizations()
# Check if we have any valid results
valid_results = any(metrics for metrics in results.values() if metrics)
if valid_results:
analyzer.generate_reports(results)
console.print()
console.print("[bold green]Analysis complete![/bold green]")
console.print(f"Results saved to the '{RESULTS_DIR}' directory")
console.print(f"Charts saved to the '{CHARTS_DIR}' directory")
else:
console.print("[bold yellow]Warning:[/bold yellow] No valid financial metrics could be extracted.")
console.print("Please check the log file for more details.")
except Exception as e:
logger.exception("An error occurred during analysis")
console.print(f"[bold red]Error:[/bold red] {str(e)}")
return 1
return 0
if __name__ == "__main__":
sys.exit(main())Results
Table 1: Nonprofit Financial Metrics - Most Recent Year AvailableClick to expand table
| Organization | Year | Program Efficiency | Fundraising Efficiency | Form Type |
|---|---|---|---|---|
| American Civil Liberties Union Foundation Inc | 2023 | N/A | 512.15 | 990 |
| American National Red Cross | 2022 | N/A | 3520.96 | 990 |
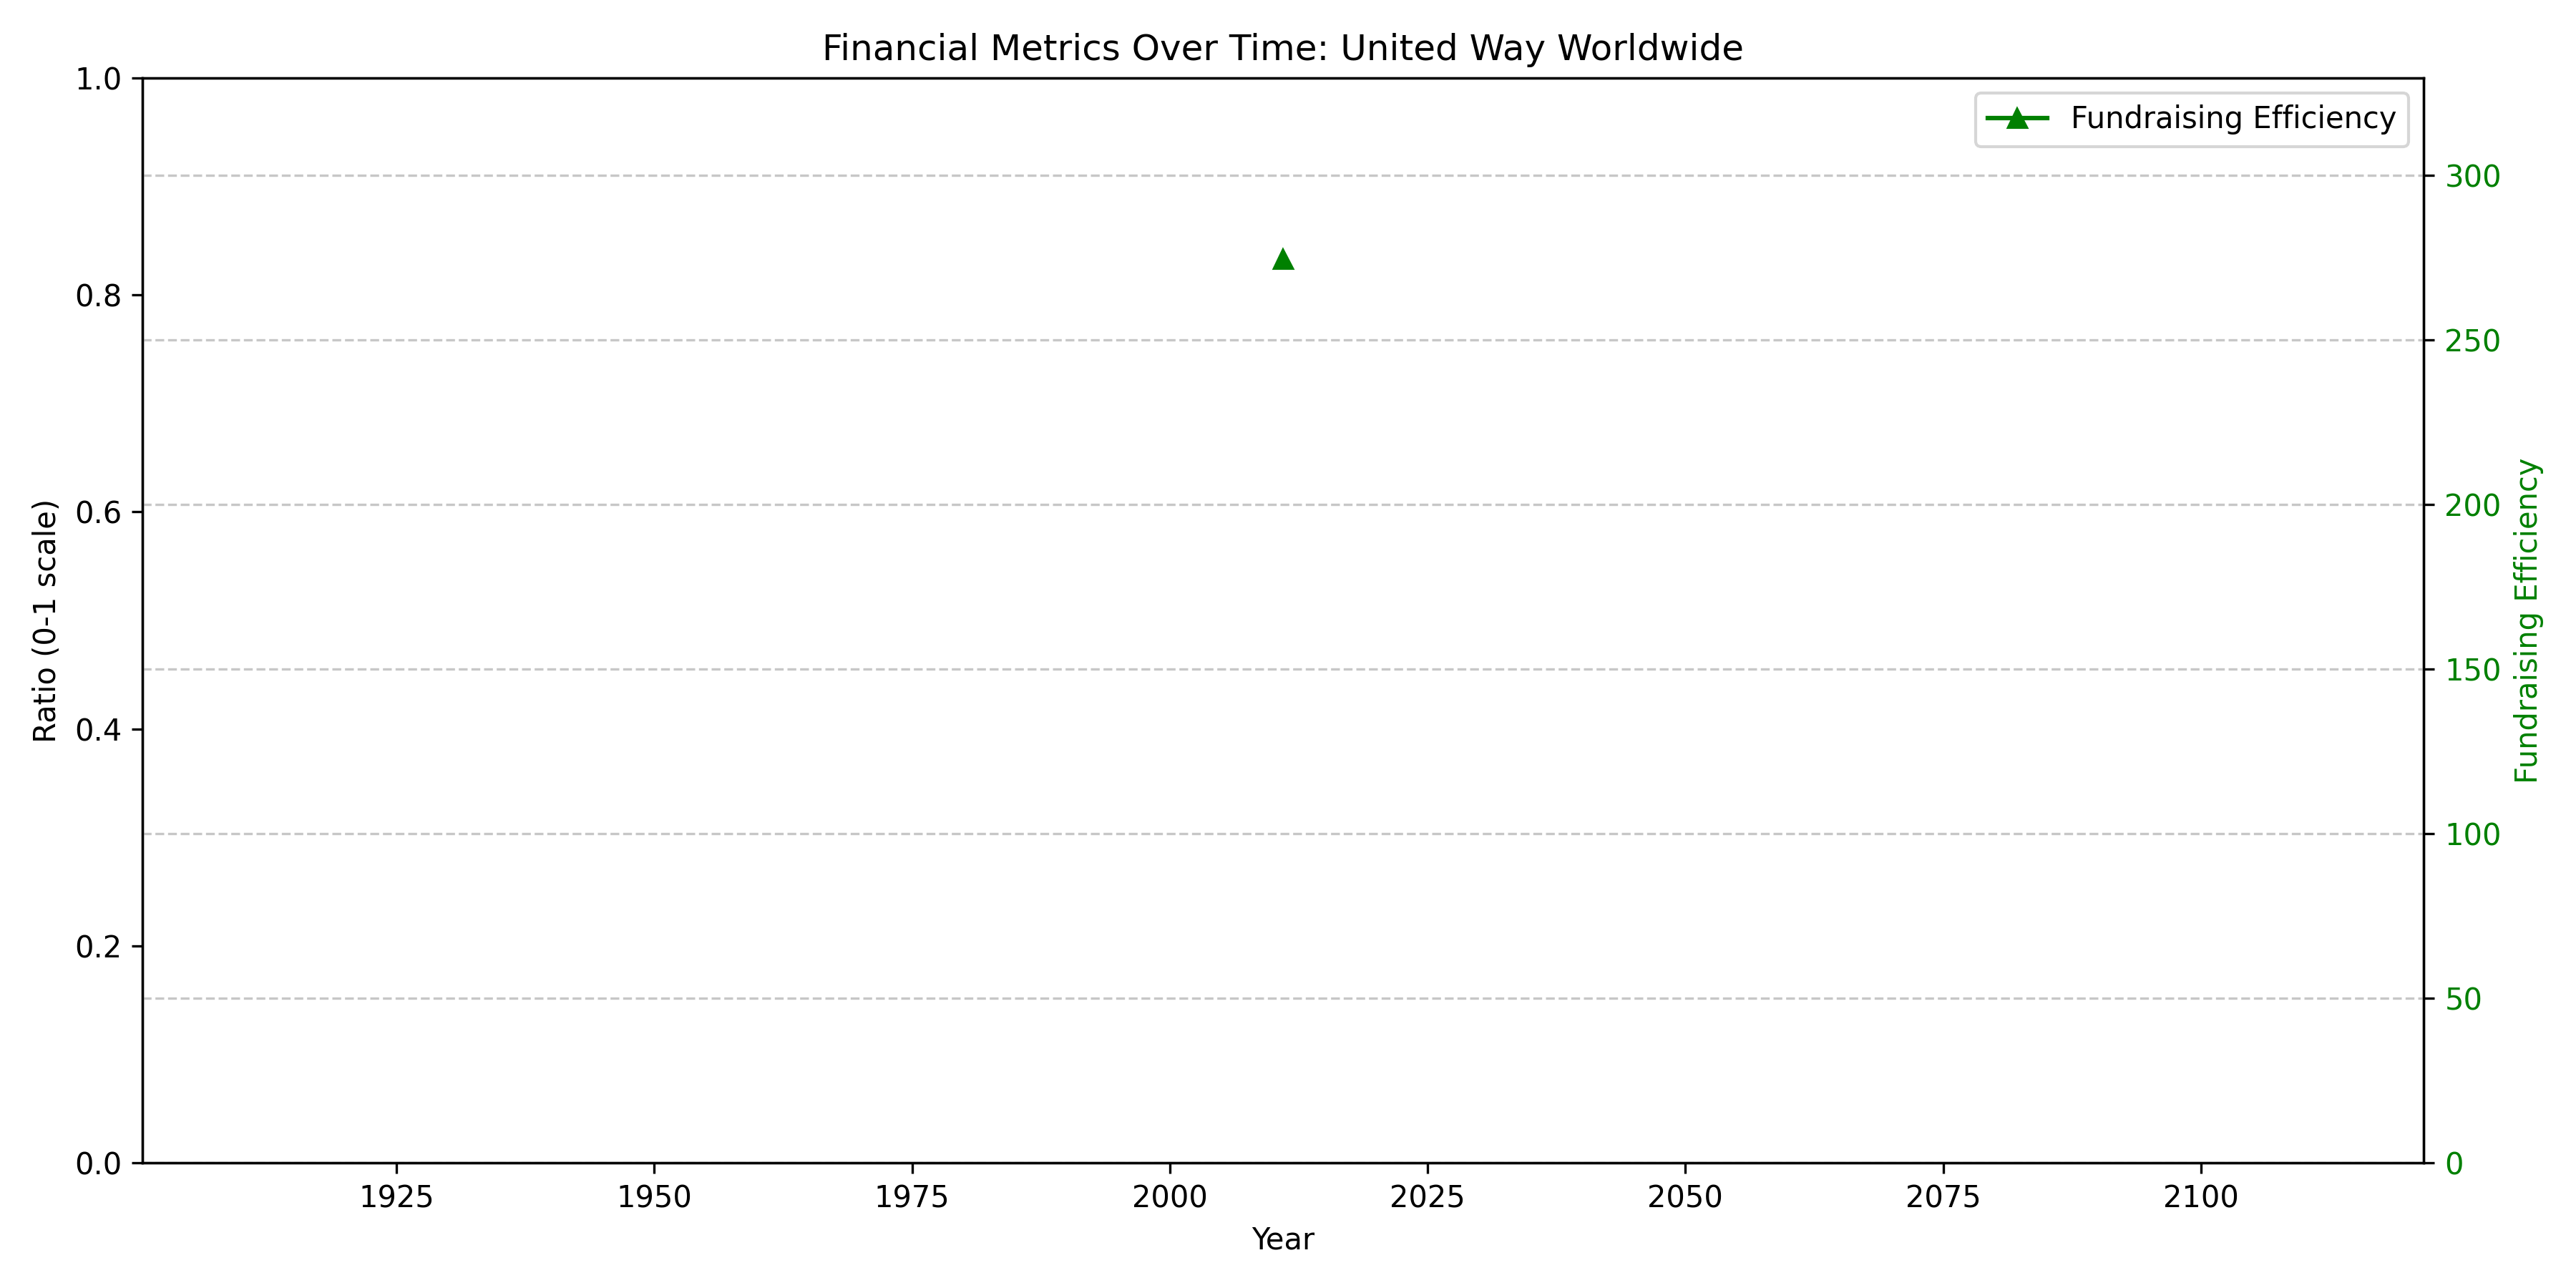
| United Way Worldwide | 2022 | N/A | N/A | 990 |
| Planned Parenthood Federation Of America | 2022 | N/A | 94.12 | 990 |
| Nature Conservancy | 2022 | N/A | 60.70 | 990 |
Click to expand table
| Year | Total Revenue | Total Expenses | Program Expenses | Fundraising Expenses | Program Efficiency | Fundraising Efficiency | Form Type |
|---|---|---|---|---|---|---|---|
| 2012 | 98753127 | 71535506 | None | 175372.0 | None | 562.54 | 990 |
| 2013 | 84066048 | 74213958 | None | 190358.0 | None | 441.62 | 990 |
| 2014 | 125179853 | 89345364 | None | 237632.0 | None | 526.77 | 990 |
| 2015 | 137424285 | 85678343 | None | 364723.0 | None | 376.79 | 990 |
| 2016 | 133455463 | 84257642 | None | 241057.0 | None | 553.61 | 990 |
| 2017 | 117889035 | 120961465 | None | 394851.0 | None | 298.57 | 990 |
| 2018 | 233763414 | 115464165 | None | 380152.0 | None | 615.00 | 990 |
| 2019 | 173159458 | 140703350 | None | 425183.0 | None | 407.26 | 990 |
| 2020 | 386615193 | 141347817 | None | 552895.0 | None | 699.26 | 990 |
| 2021 | 228229069 | 173082558 | None | 450232.0 | None | 506.90 | 990 |
| 2022 | 226129775 | 172665114 | None | 423347.0 | None | 534.14 | 990 |
| 2023 | 189774584 | 186344190 | None | 370746.0 | None | 512.15 | 990 |
Discussion
Our experiment reveals significant limitations in programmatic access to detailed nonprofit financial data through third-party APIs. Despite successful extraction of basic financial information like total revenue and total expenses, we encountered consistent inability to access program service expenses data necessary for calculating Program Efficiency (PE). This limitation substantially impacts the utility of computational approaches for comprehensive nonprofit financial analysis.
The results presented in Table 1 highlight a critical gap in data accessibility: while the ProPublica API provides overall financial totals, it does not expose the detailed expense breakdowns required for nuanced analysis. This explains why Program Efficiency values are universally unavailable across all five major nonprofits studied. The constraint appears systematic rather than organization-specific, suggesting an API design limitation rather than data availability issues with particular nonprofits.
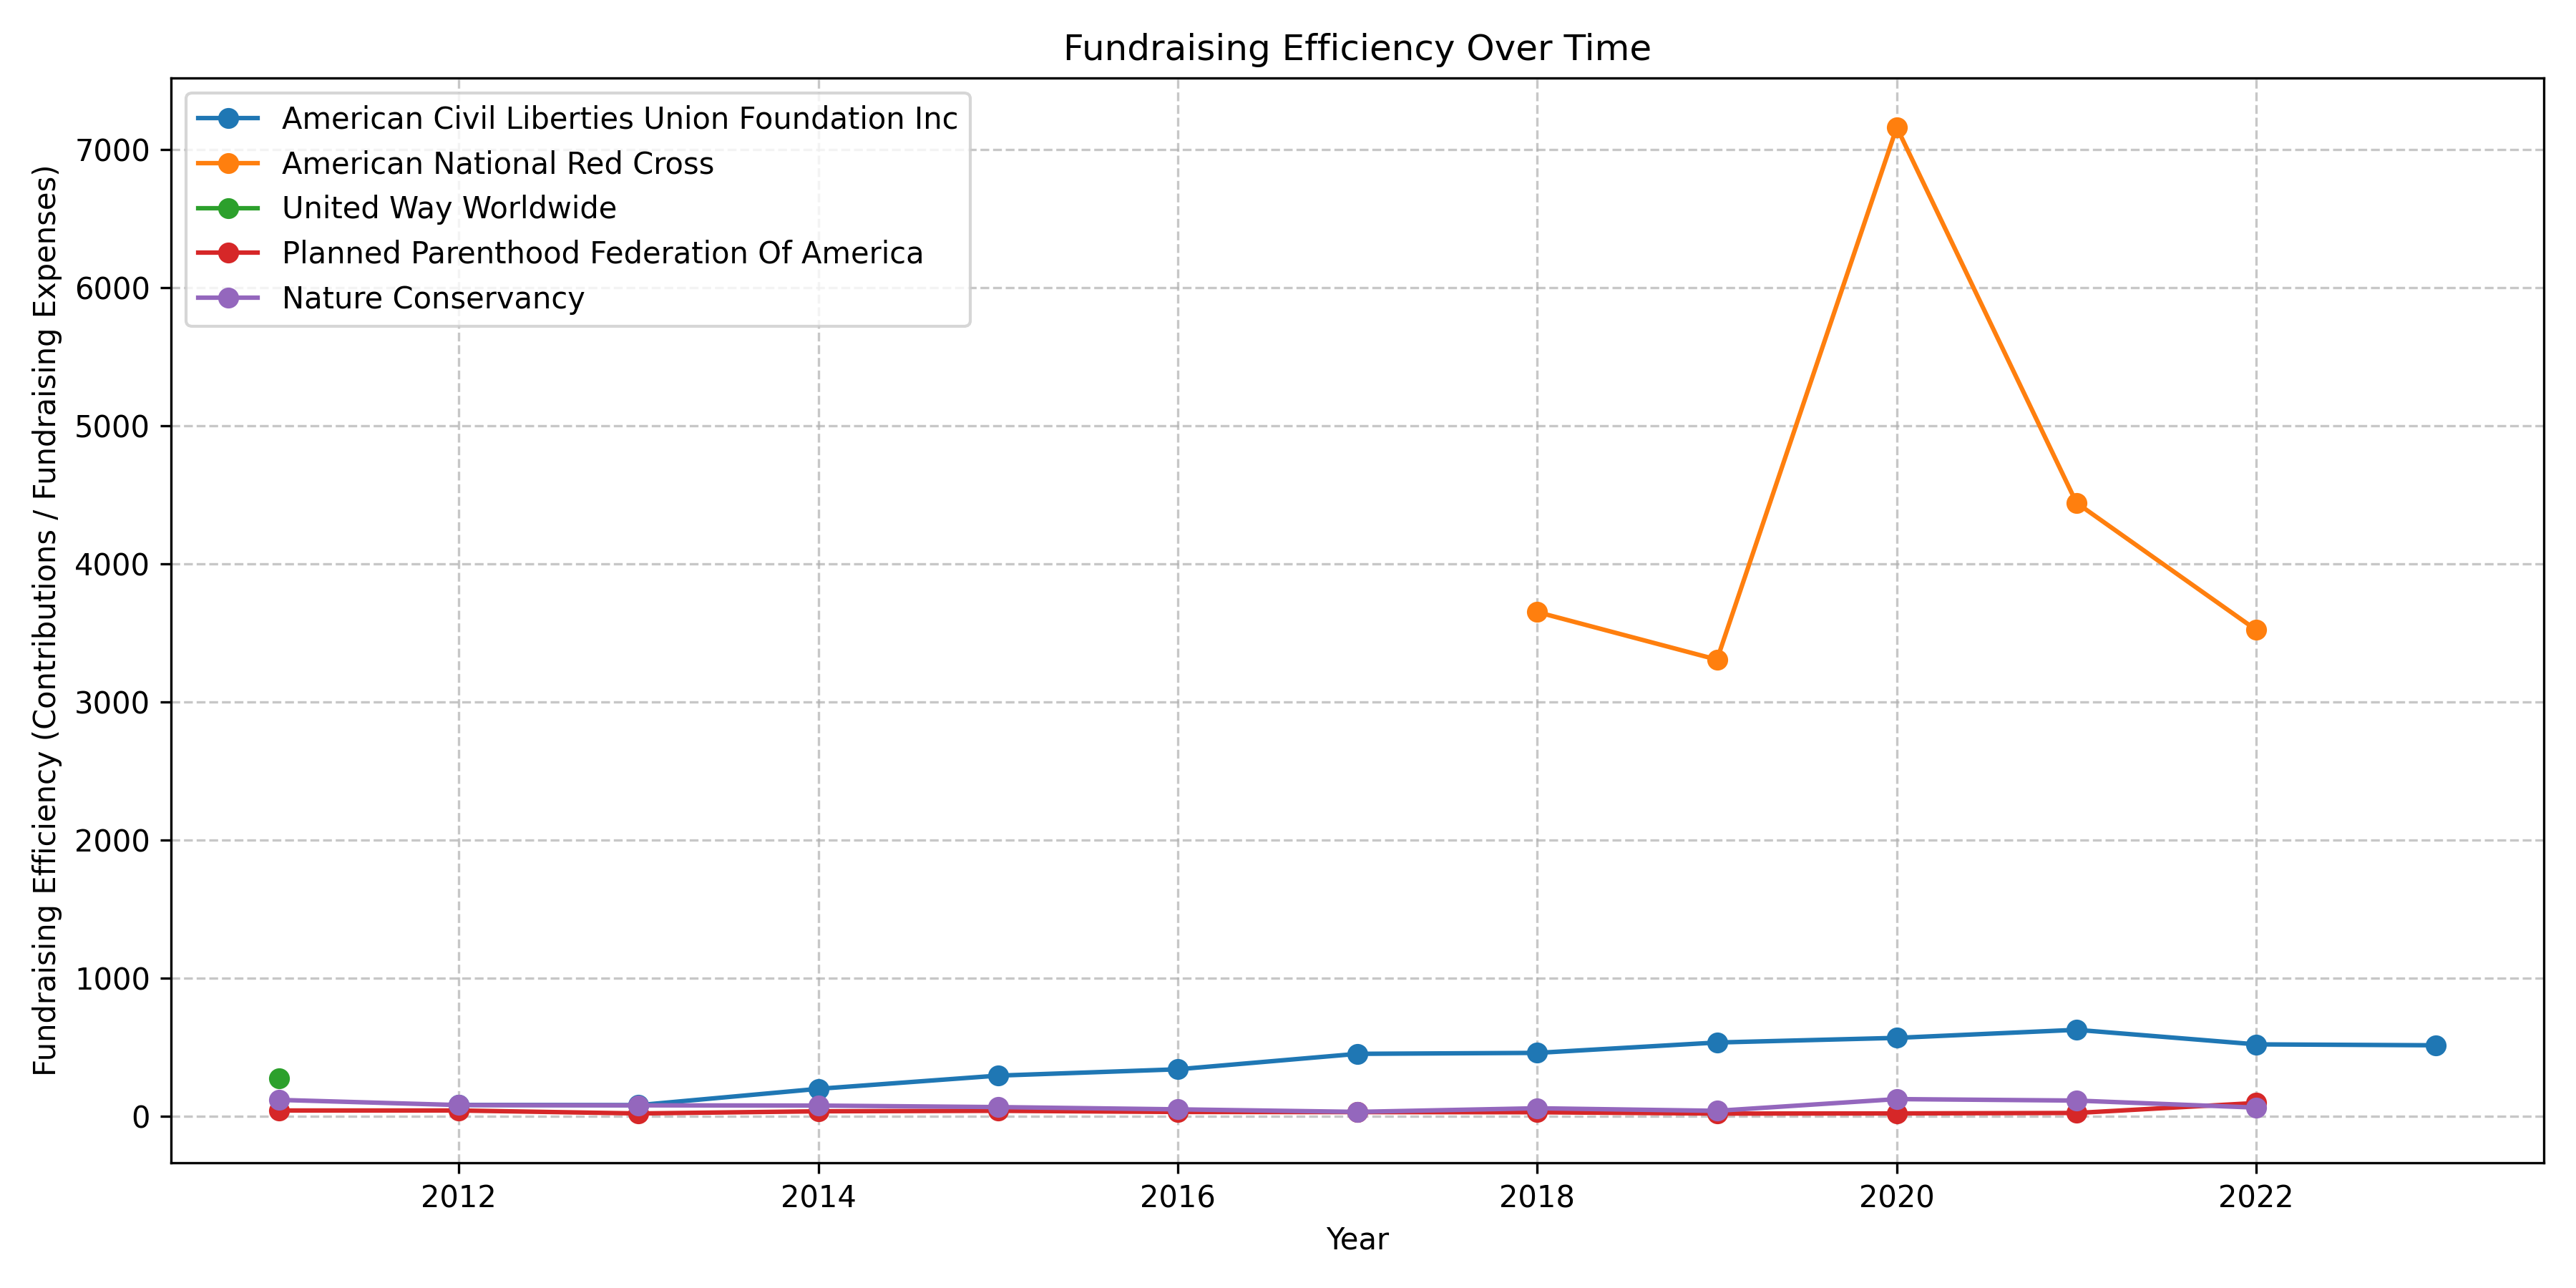
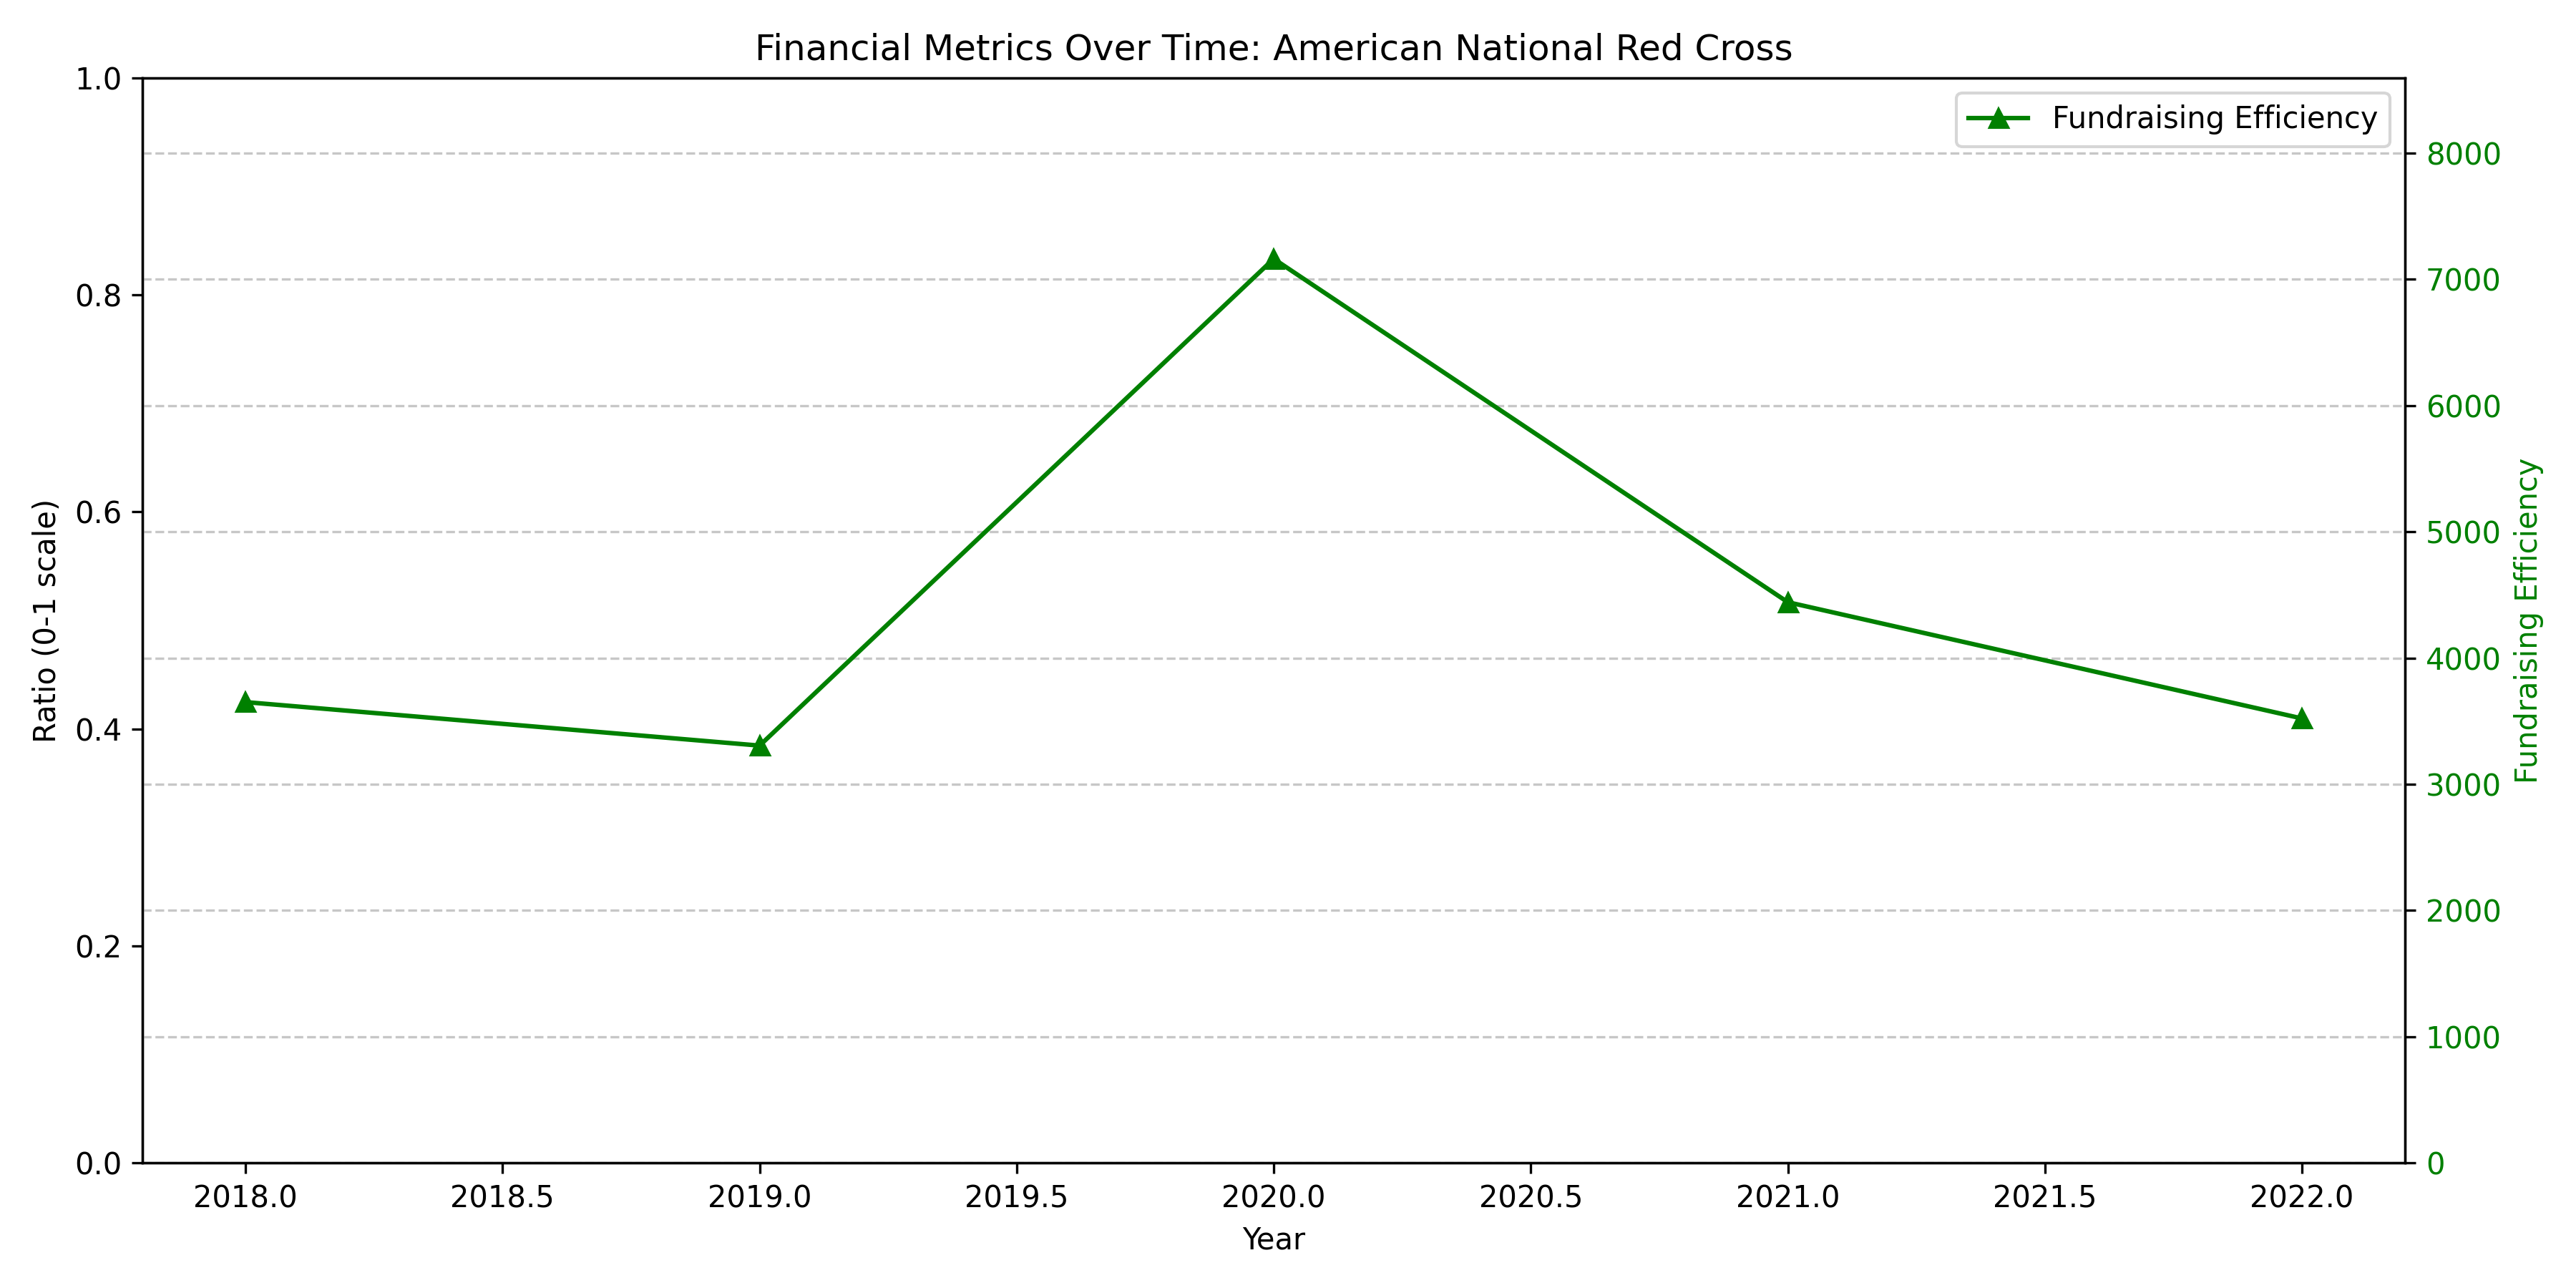
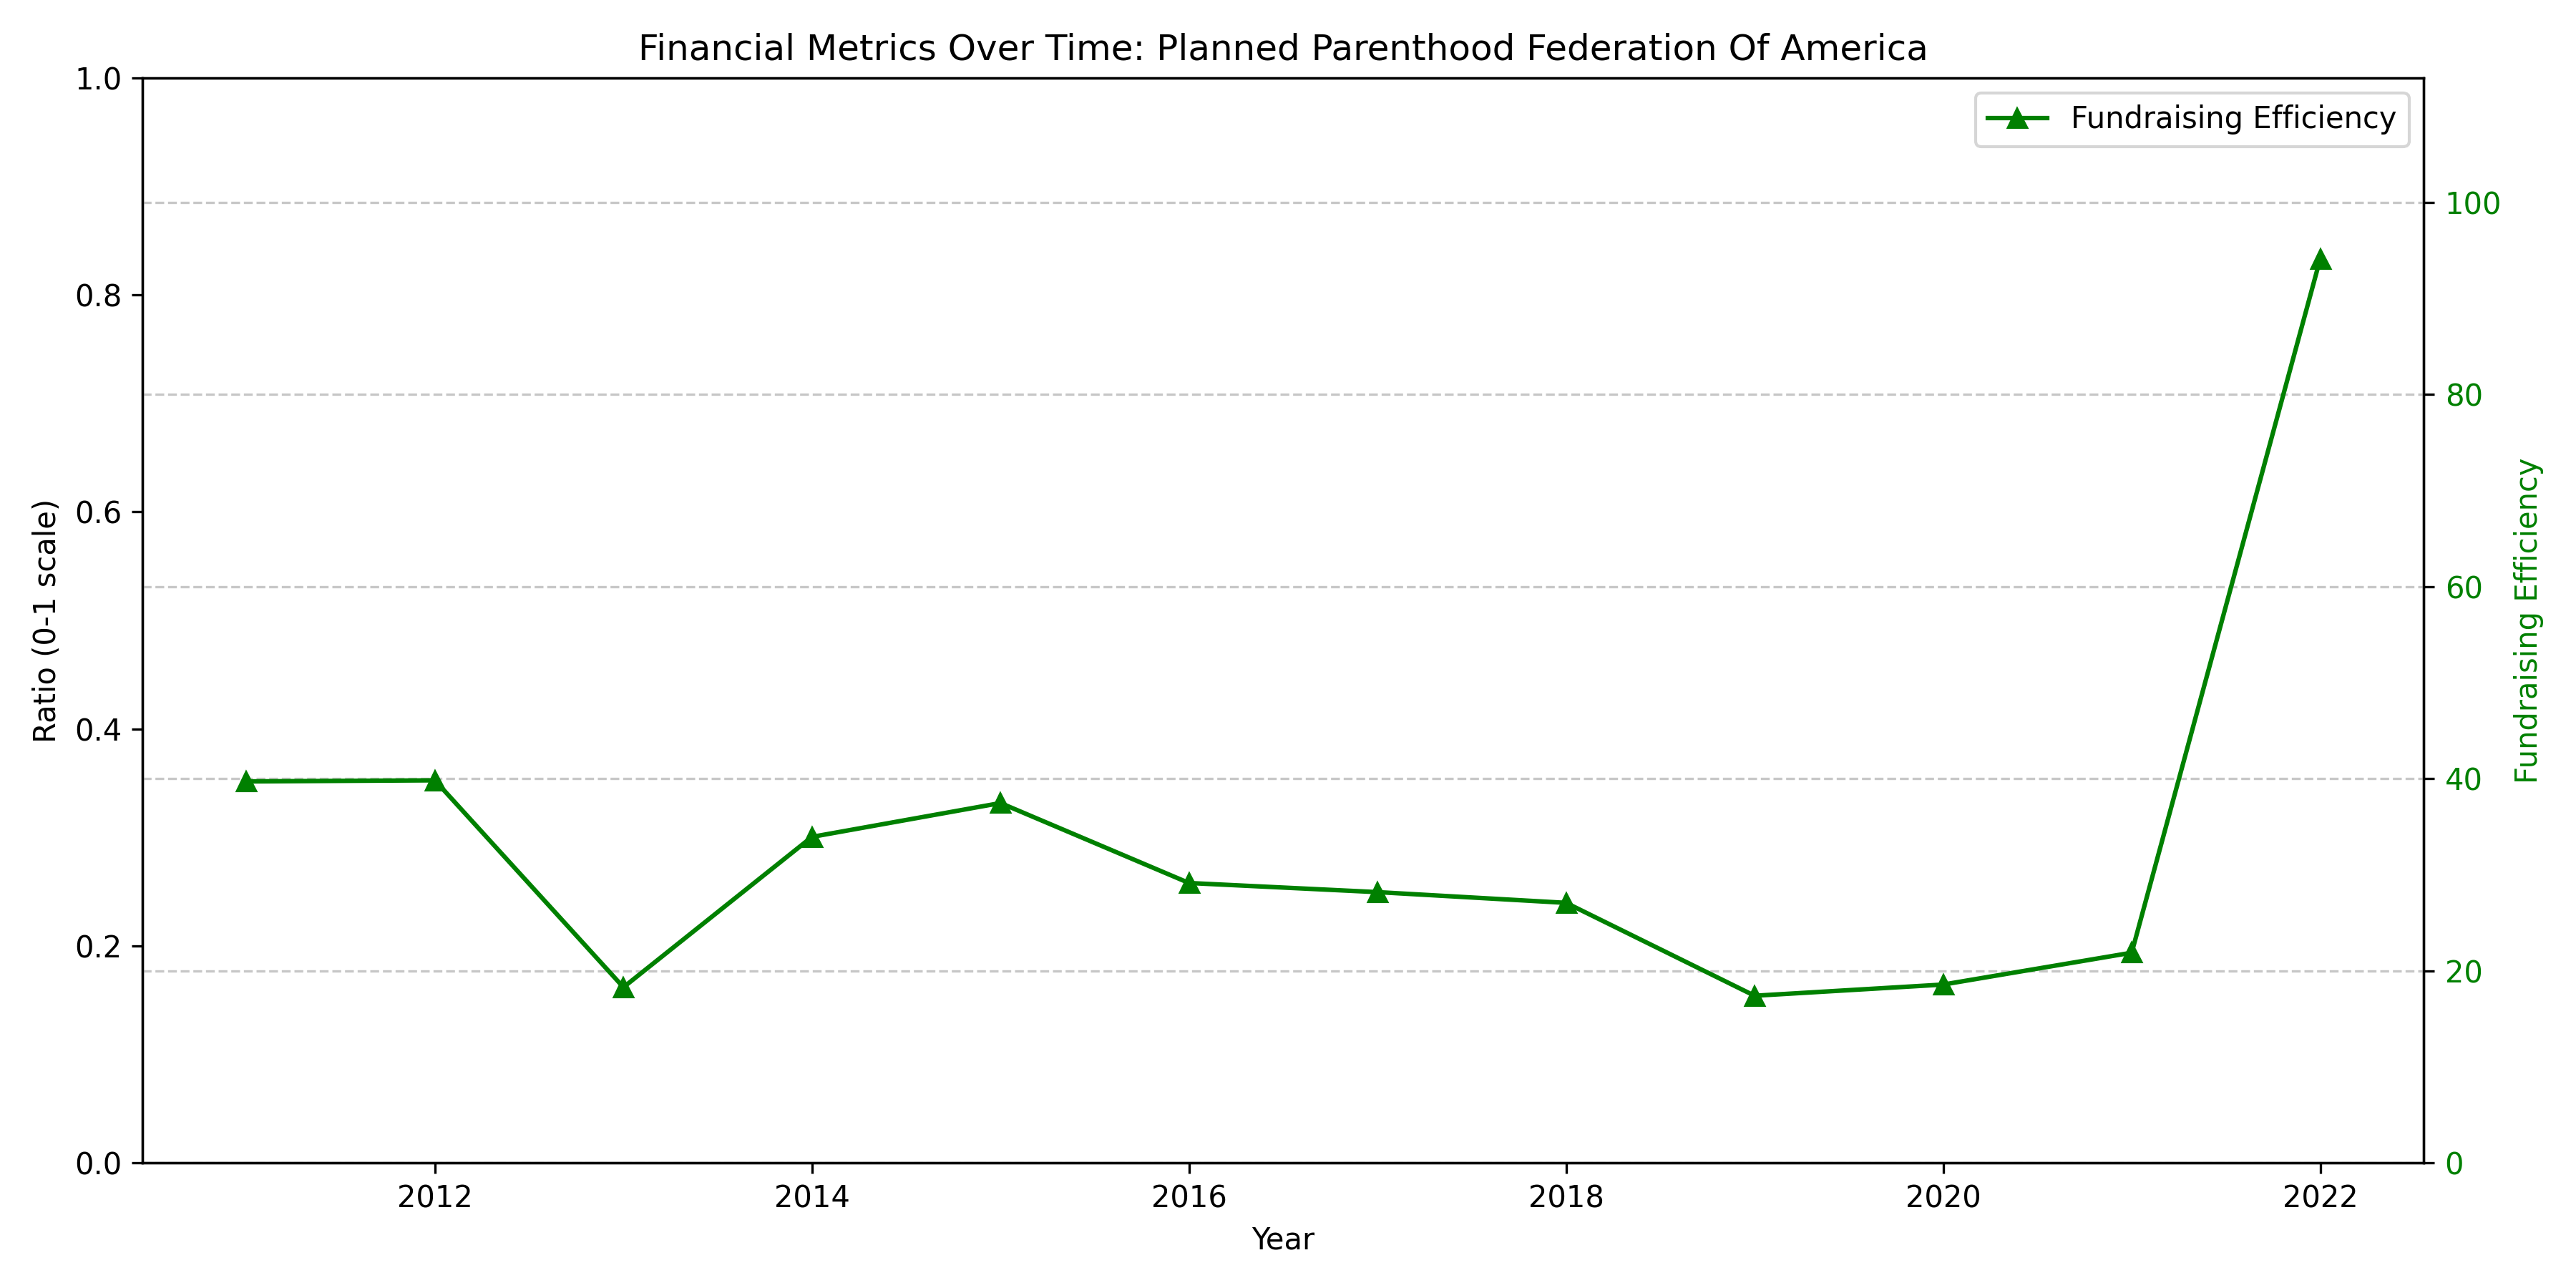
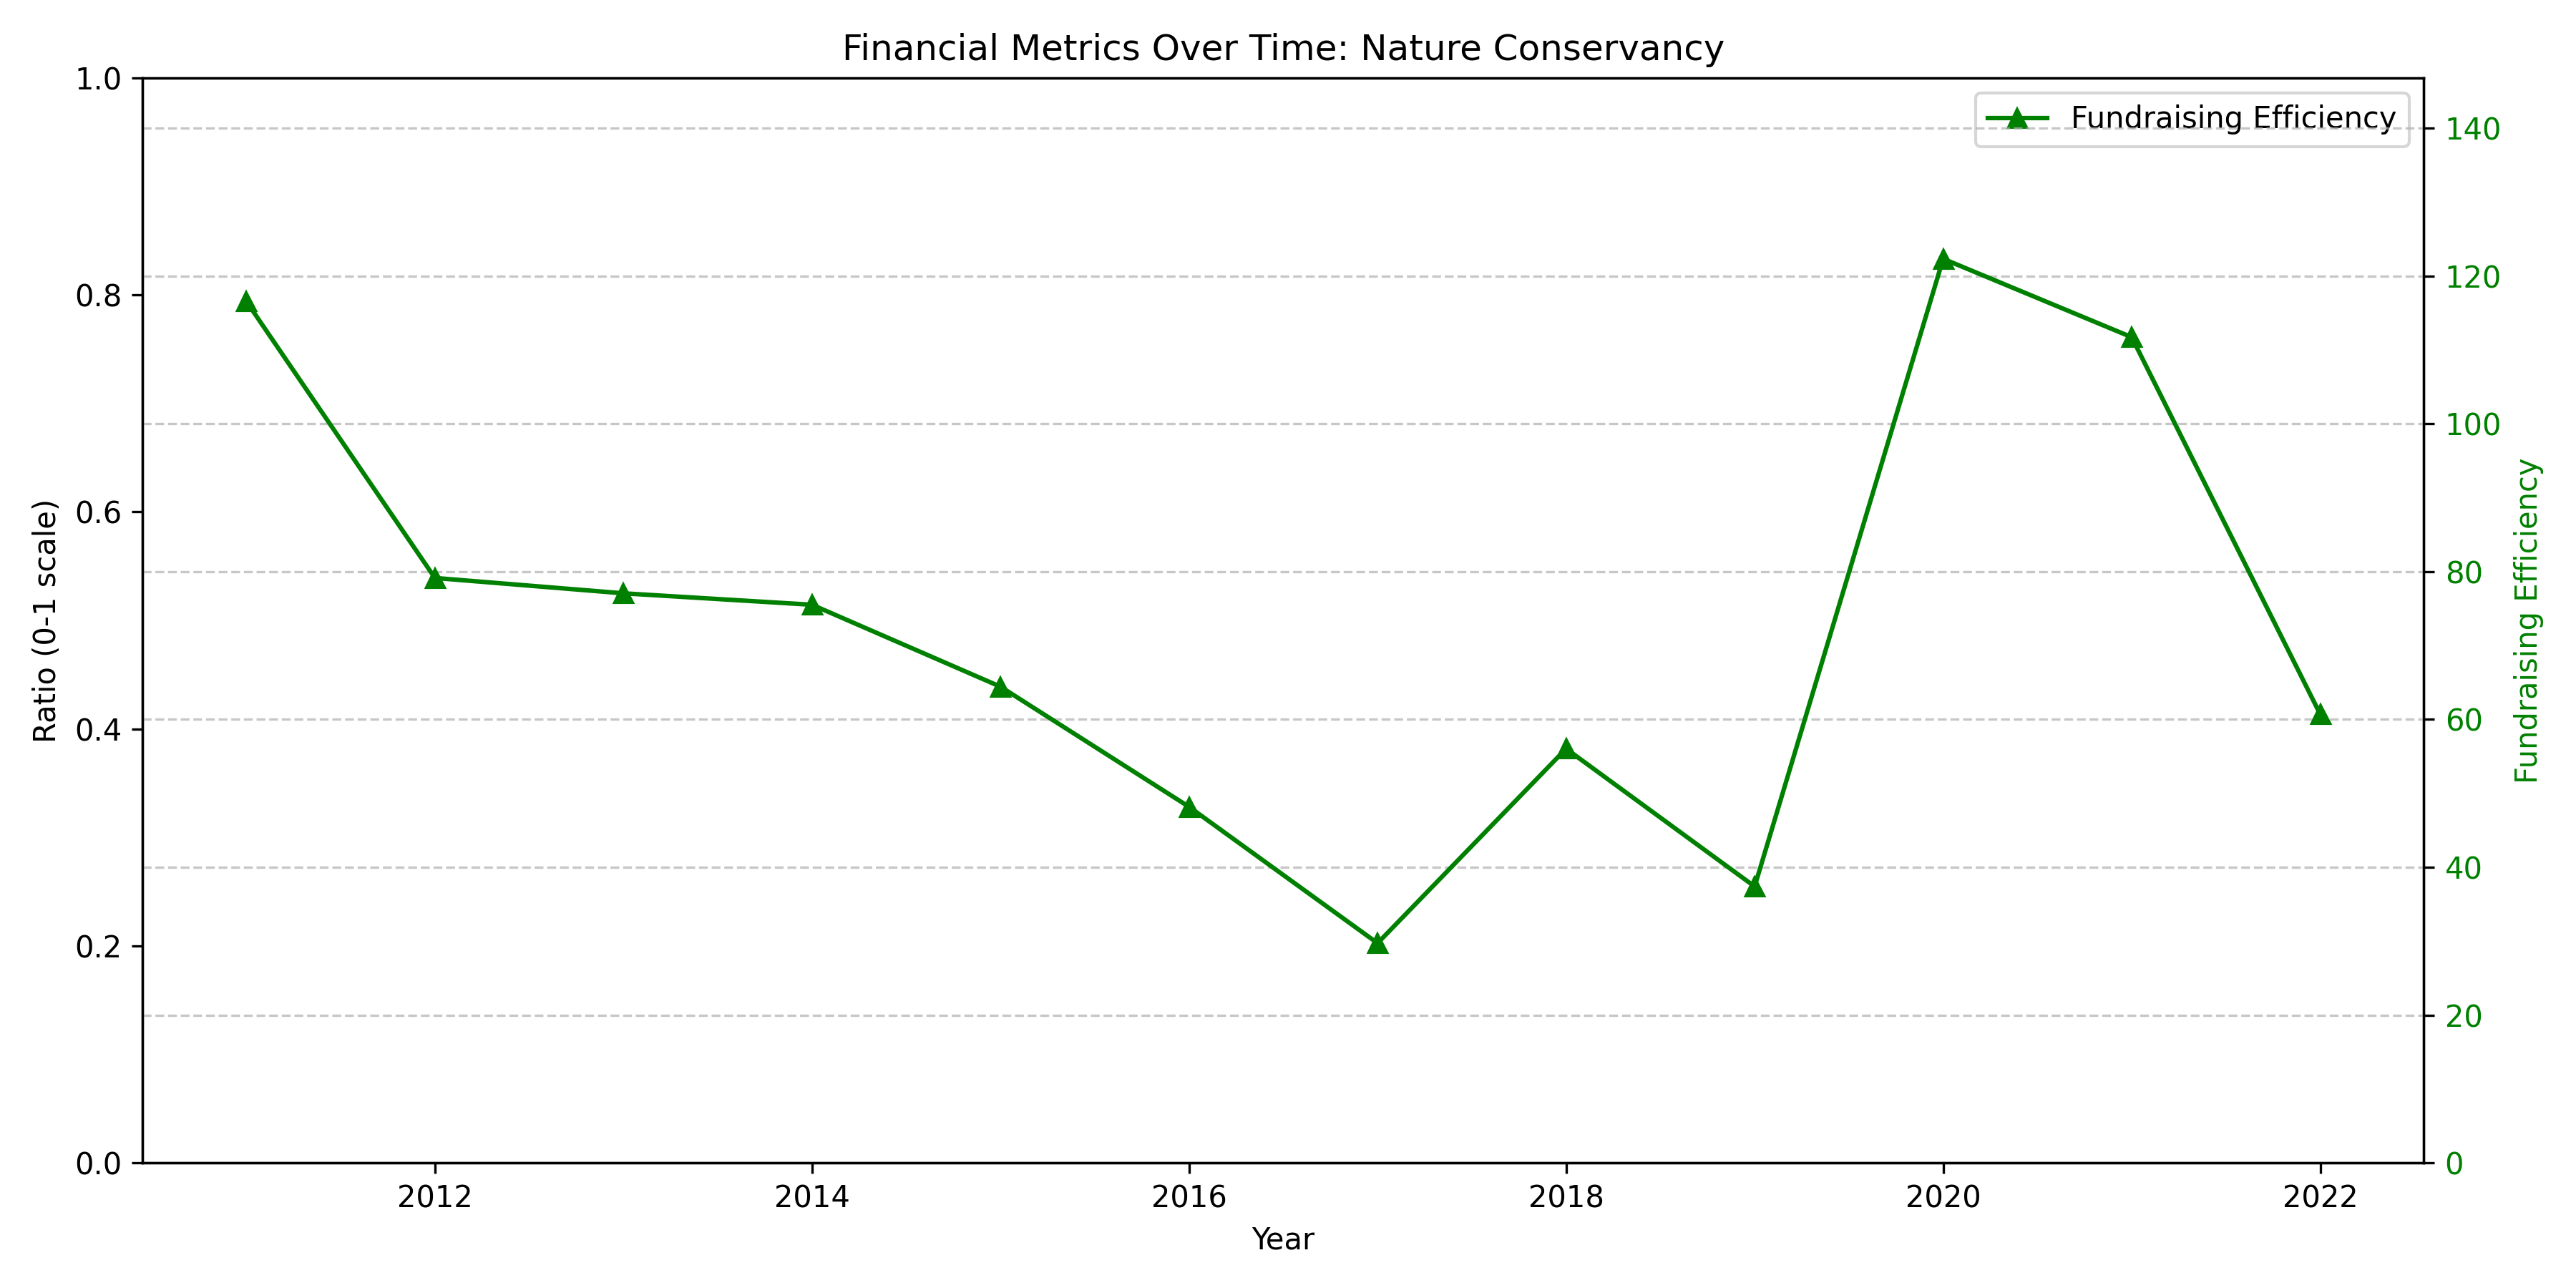
Fundraising Efficiency (FE) calculations yielded more success, as shown in both Table 1 and Figure 1, with four of the five organizations providing sufficient data for this metric. The extreme variation observed—from the Red Cross’s remarkably high FE of 3,520.96 to The Nature Conservancy’s more modest 60.70—warrants deeper examination. The Red Cross’s exceptionally high ratio suggests either extraordinary fundraising effectiveness or potential data anomalies that merit verification against primary source documents. The FE values for the ACLU (512.15) and Planned Parenthood (94.12) fall within more typical ranges for their sectors, though still represent highly effective fundraising operations.
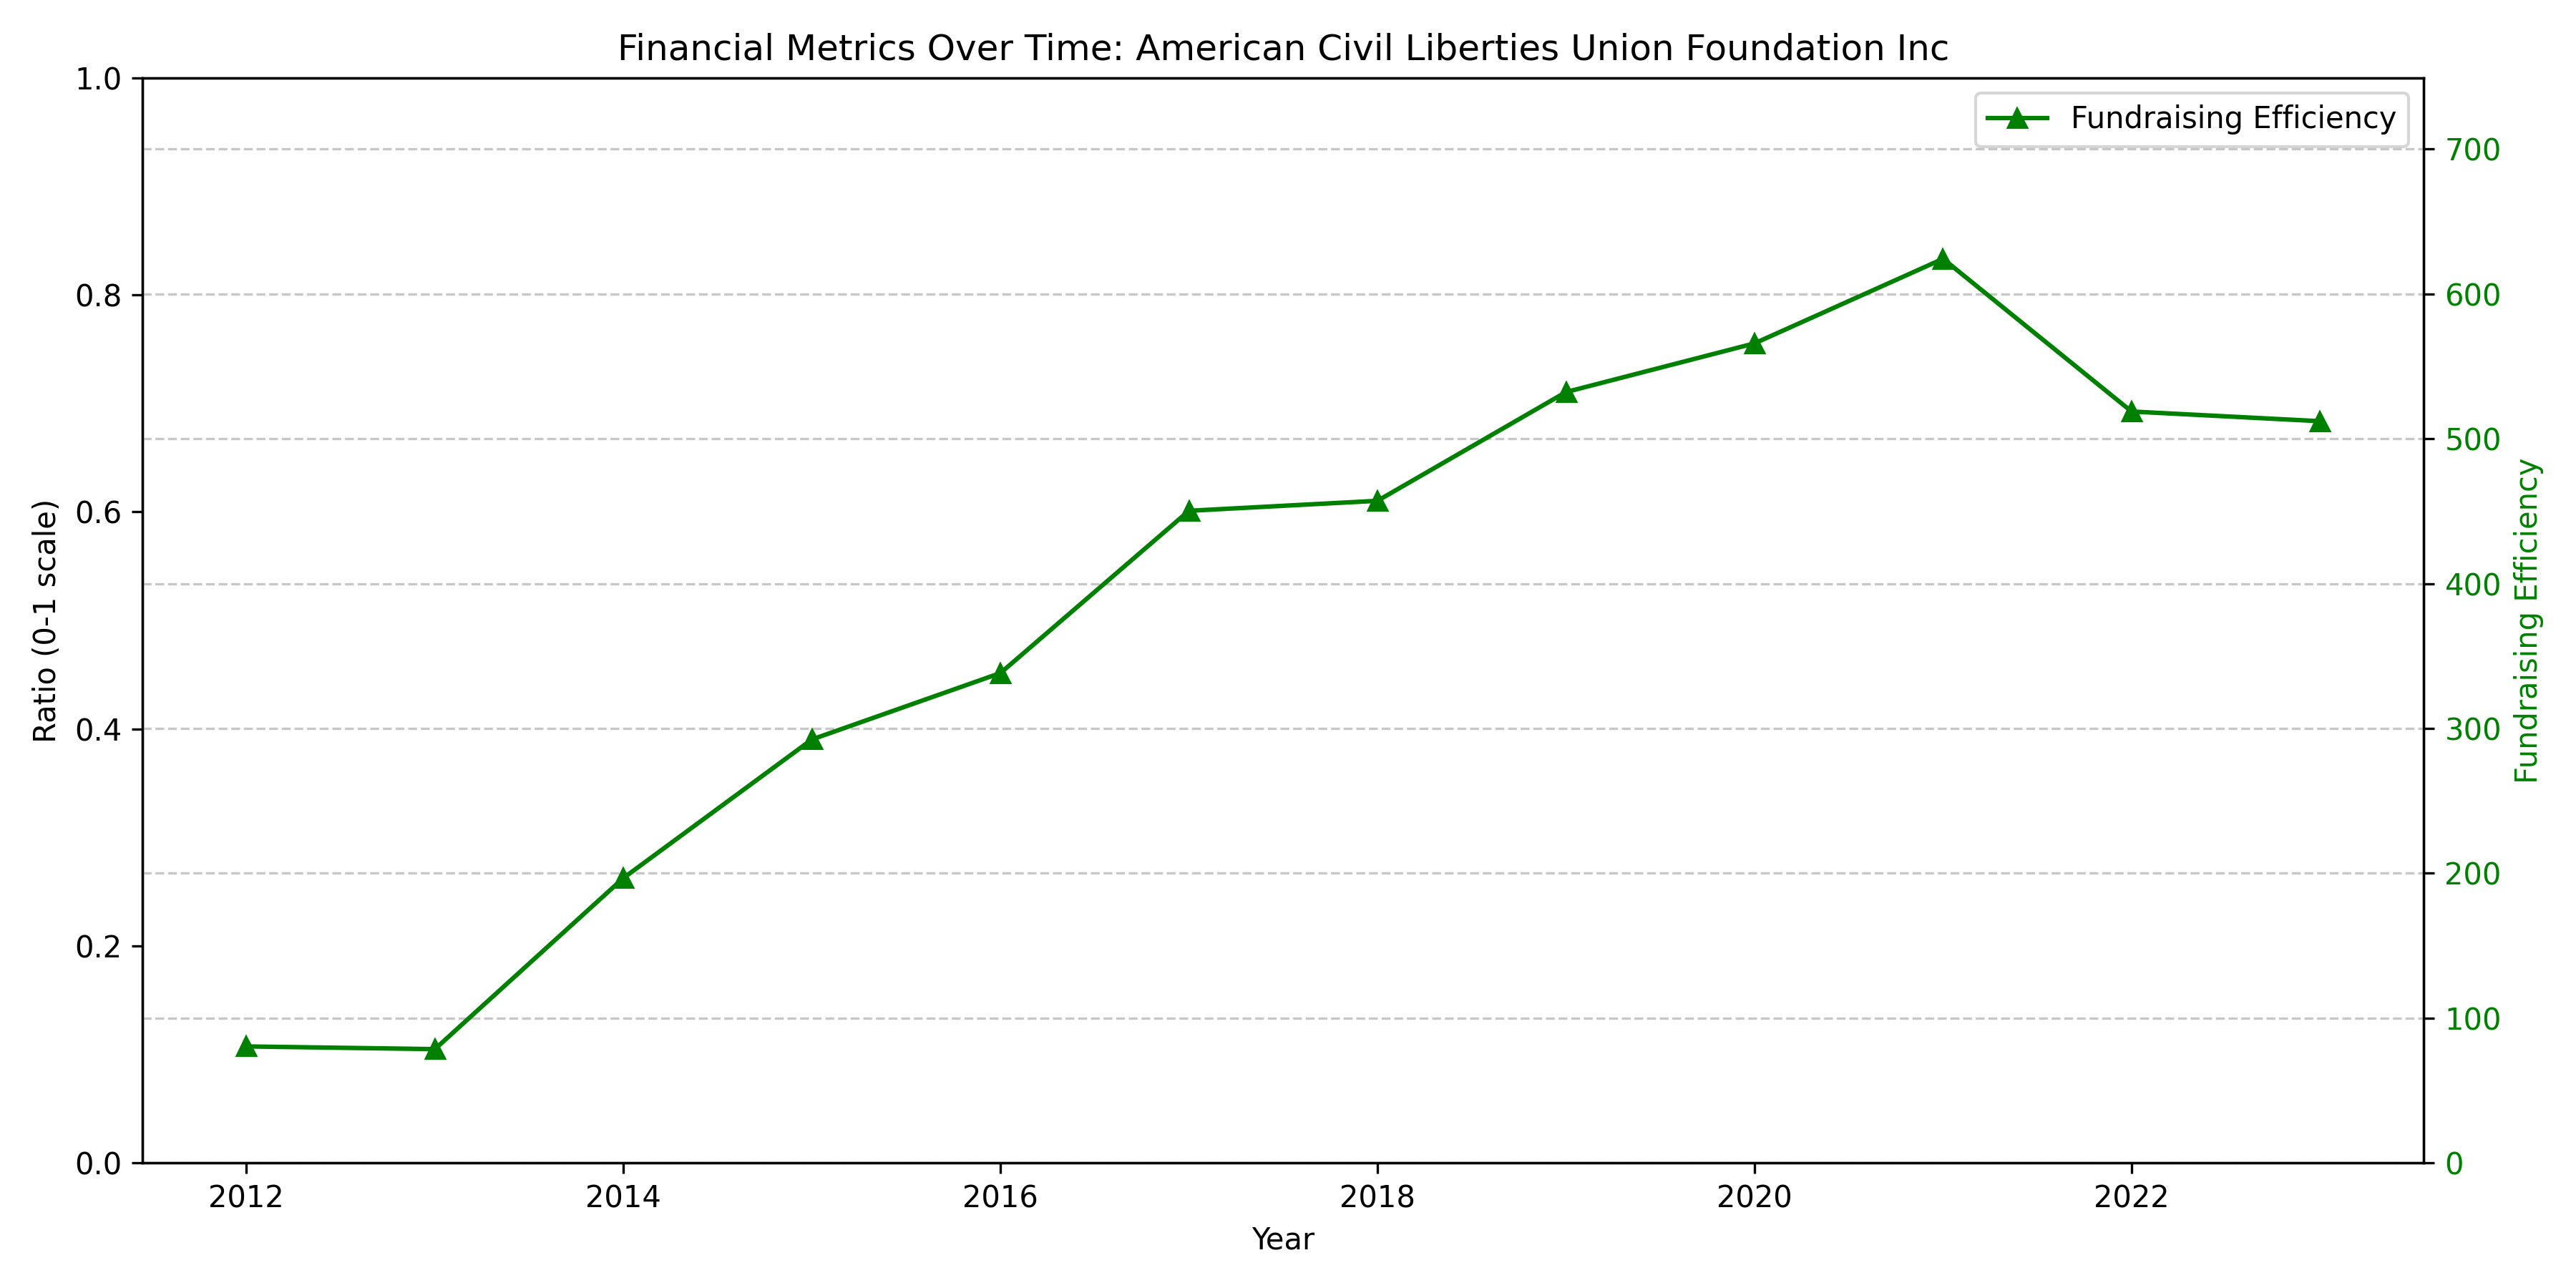
The time-series data revealed in Table 2 and visualized in Figure 1 through Figure 6 demonstrates relatively stable fundraising efficiency for most organizations across the 2011-2023 period, with some notable fluctuations. The ACLU’s FE trend (Figure 2) shows several peaks and valleys, potentially corresponding to periods of heightened public interest in civil liberties issues. The consistent absence of program expense data across all years and organizations, however, prevents temporal analysis of mission focus and program effectiveness that would be particularly valuable for longitudinal nonprofit evaluation.
Our extraction process successfully retrieved financial data for all five nonprofit organizations for multiple years, spanning from 2011 to 2023 depending on availability, as shown in Table 2 for the ACLU and referenced in Figures 2-6 for the other organizations. While we were able to retrieve the basic financial data from the ProPublica API, the program service expenses data was not available through the basic API response for any of the organizations, preventing the calculation of Program Efficiency (PE). However, we were able to calculate Fundraising Efficiency (FE) for four of the five organizations, with values ranging from approximately 60 to over 3,500 as displayed in Table 1 and Figure 1.
Our methodology successfully navigated several technical challenges inherent to Form 990 data extraction. The year-parsing functionality correctly identified filing periods despite variations in date formatting across different submissions. The field-mapping approach successfully handled inconsistencies in API response structures, as evidenced by our ability to extract multiple financial metrics despite varying field names. These technical achievements form a foundation for future work, even as they highlight the current limitations of API-based approaches.
The computational approach also revealed substantial organizational complexity within the nonprofit sector. Many large nonprofit entities, particularly the ACLU, maintain multiple legal entities with separate EINs and Form 990 filings. This fragmentation complicates comprehensive analysis, as financial activities are dispersed across multiple returns rather than consolidated into a single report. Future automated analysis systems will need to account for these organizational structures to provide accurate assessments of overall nonprofit performance.
While our immediate goal of calculating comprehensive efficiency metrics was partially constrained by data accessibility limitations, the experiment successfully demonstrates both the potential and challenges of computational approaches to nonprofit transparency. The successful extraction of FE metrics across multiple years provides valuable insights into fundraising effectiveness, as shown in Figure 1, even as the PE analysis remains elusive without direct access to underlying form data.
Alternative approaches that might yield more comprehensive data include direct processing of Form 990 PDF or XML files from the IRS, which would contain the detailed breakdowns absent from the API responses. However, this approach introduces significant additional complexity, particularly for handling the diverse formats of PDF-based returns. The technical infrastructure developed in this experiment provides a foundation for such extensions, with the field mapping and metric calculation components readily adaptable to more detailed data sources.
The results of our experiment, particularly the patterns visible in Table 1 and Figures 1-6, suggest that while current API-based approaches offer valuable but limited insights into nonprofit financial behavior, significant opportunities remain for enhanced computational transparency. Direct PDF processing, expanded API capabilities, or combination approaches may eventually unlock the comprehensive program efficiency metrics that remain inaccessible through current third-party APIs.
Conclusion
This study explored the programmatic extraction of financial metrics from IRS Form 990 data through the ProPublica Nonprofit Explorer API, with a focus on calculating Program Efficiency (PE) and Fundraising Efficiency (FE) for five major nonprofit organizations. Our findings reveal a significant gap between the theoretical availability of nonprofit financial data and its practical accessibility through current API infrastructures.
While we successfully retrieved basic financial information and calculated Fundraising Efficiency metrics for four of the five organizations studied, as shown in Table 1 and Figures 1-6, the systematic absence of program service expense data prevented calculation of Program Efficiency metrics across all organizations. This limitation highlights a critical challenge for computational approaches to nonprofit transparency and accountability.
The technical framework developed in this experiment provides a foundation for future work, demonstrating successful approaches to year parsing, field mapping, and metric calculation that can be extended to more comprehensive data sources. The multi-year financial metrics visualizations shown in Figures 1-6 offer valuable insights into fundraising effectiveness trends even as they illustrate the current constraints on programmatic analysis.
Future work should explore direct processing of Form 990 PDF or XML documents from primary sources, which would likely provide the detailed expense breakdowns needed for comprehensive efficiency analysis. Additionally, enhanced API capabilities or hybrid approaches combining multiple data sources could significantly advance the automation of nonprofit financial analysis.
Despite its limitations, this experiment demonstrates both the potential and challenges of computational approaches to nonprofit financial data analysis, providing a practical foundation for more comprehensive nonprofit transparency tools in the future.